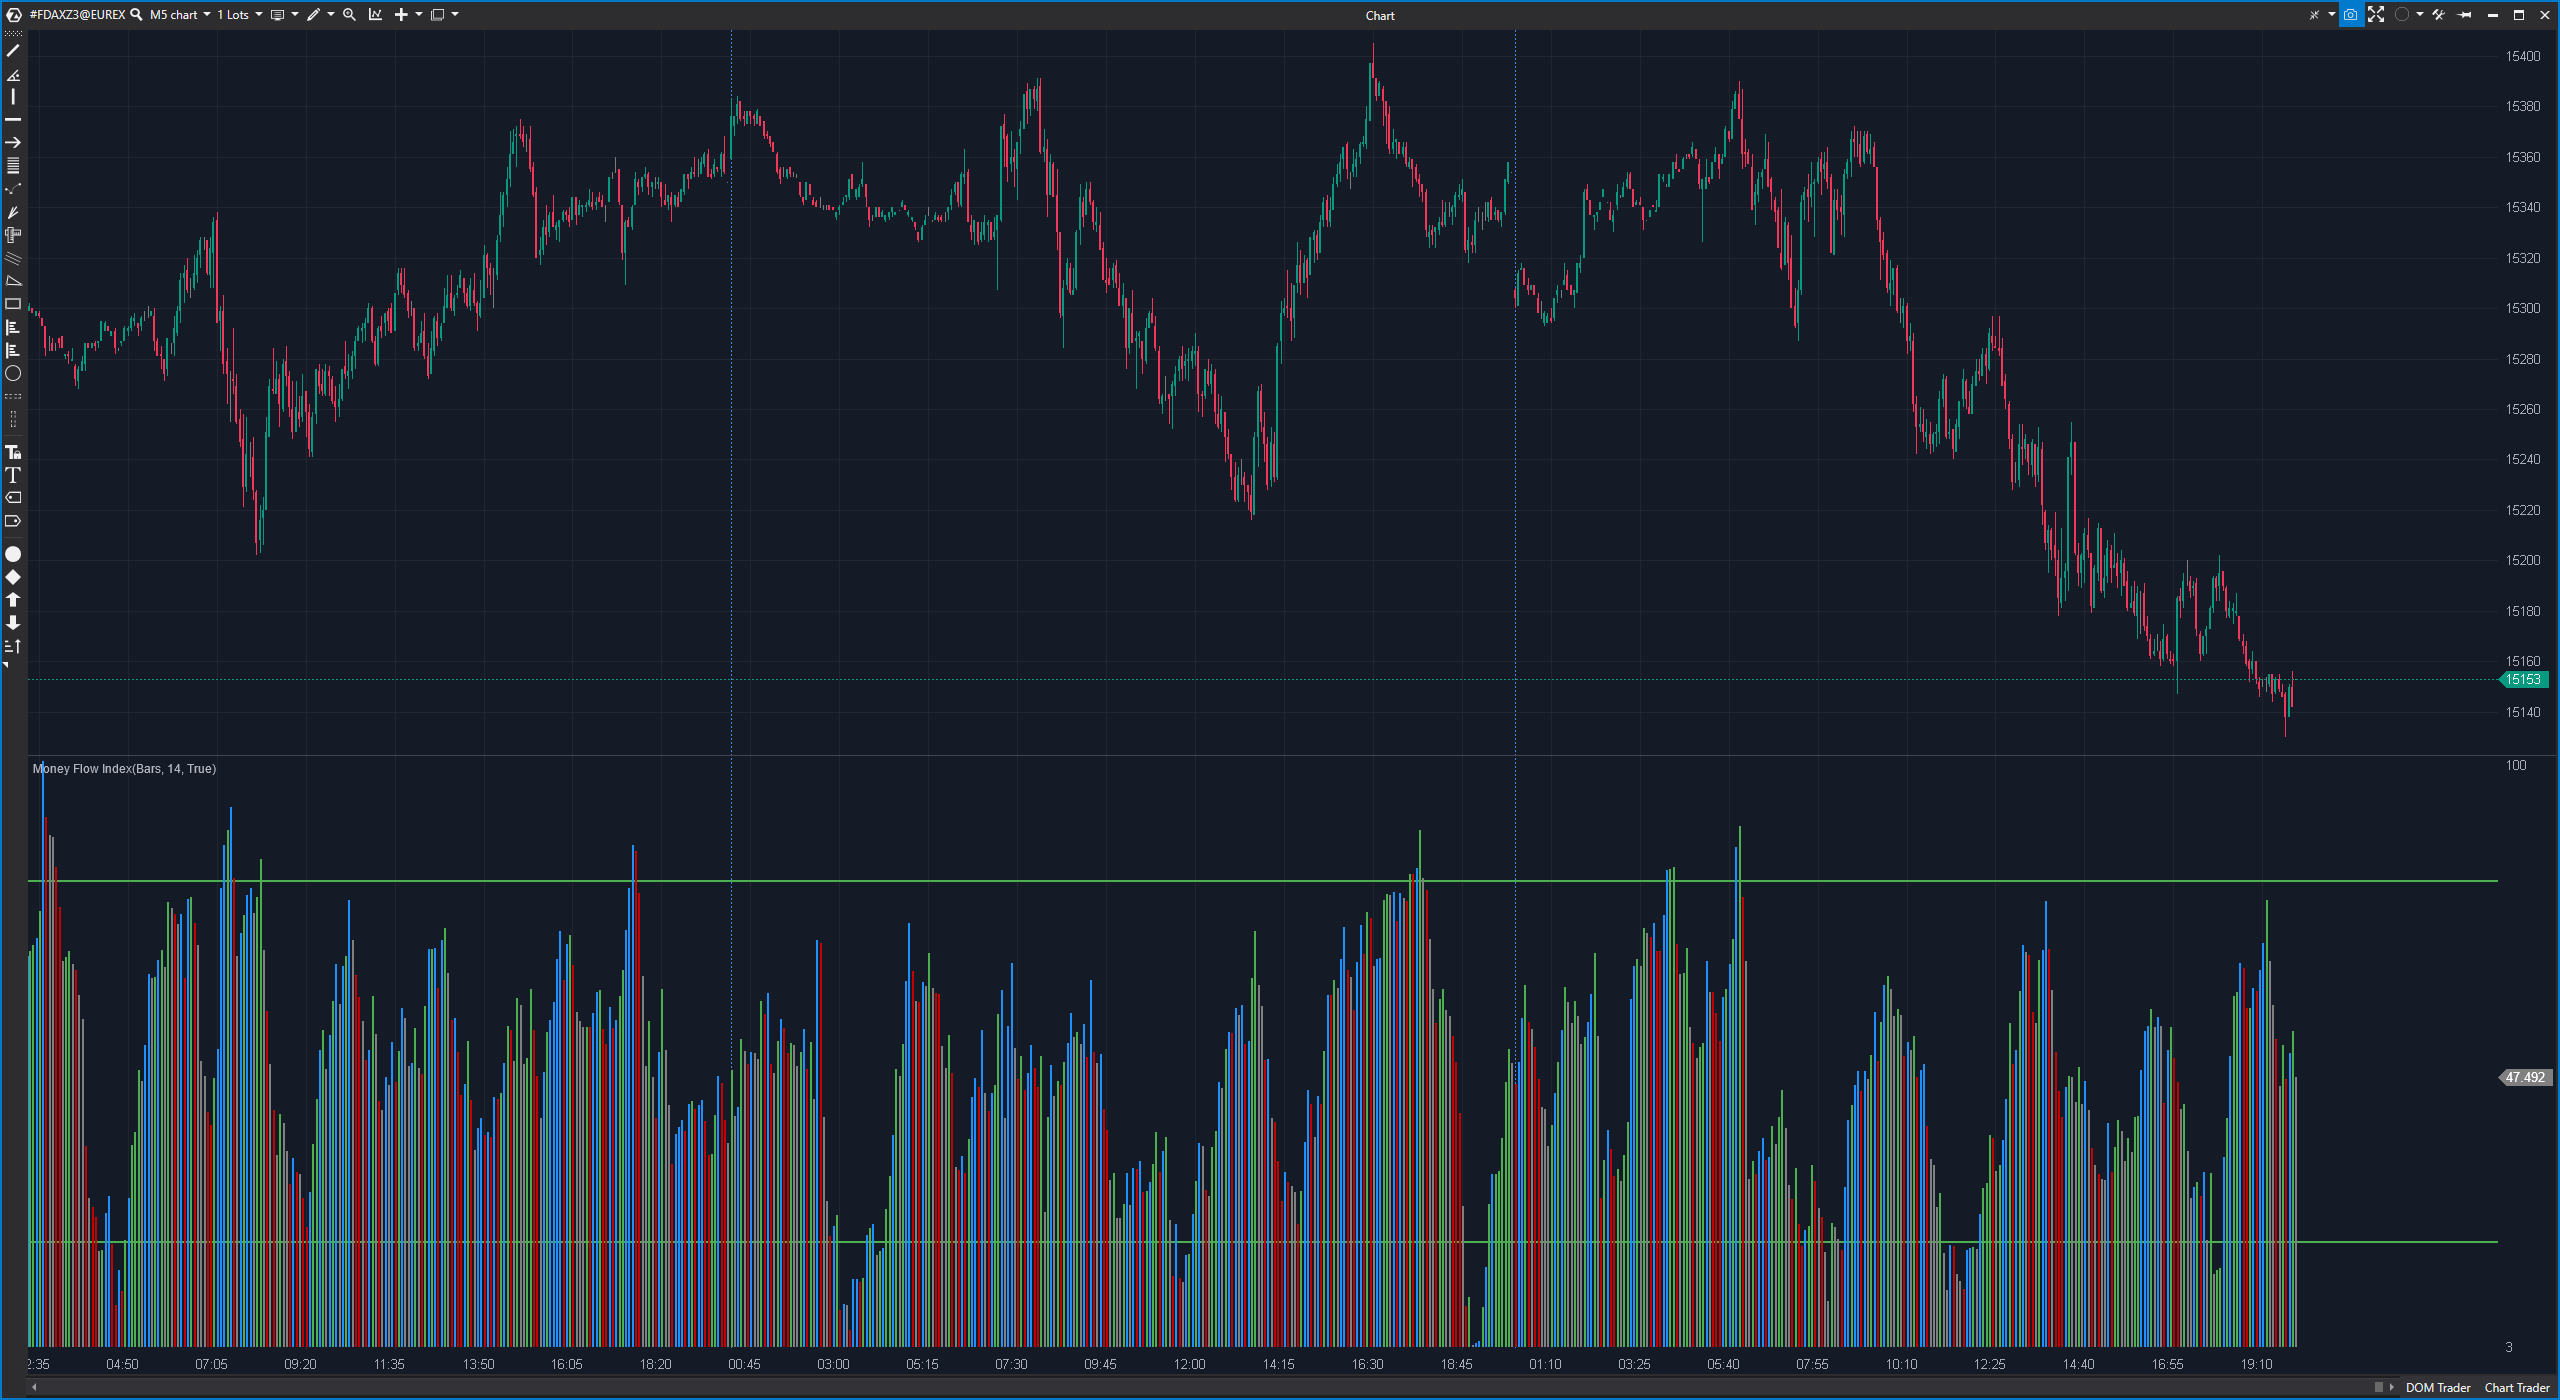
The Money Flow Index (MFI) is a technical indicator in financial analysis that was developed to measure the flow of money into and out of an asset. The MFI combines elements of price and volume to quantify buying and selling pressure and identify potential trend reversals or continuations.
How the Money Flow Index (MFI) works:
The MFI is based on the concept of money flow, which is derived from the price and trading volume. Here are the basic steps for calculating the MFI:
Typical price (TP): Calculate the average price of a day by dividing the sum of the highest price, the lowest price and the closing price of the day by 3:
TP = (Highest price + lowest price + closing price) / 3
Money Flow (MF): Calculate the money flow of a day by multiplying the typical price by the trading volume and determining whether the closing price is higher or lower than the previous day’s closing price:
MF = TP x trading volume
Positive Money Flow (PMF) and Negative Money Flow (NMF): Separate the money flow into positive and negative flows, depending on whether the closing price is higher or lower than the previous day’s closing price. Calculate the sum of PMF and NMF over a given period (usually 14 periods).
Money Ratio (MR): Calculate the money ratio (MR) by dividing the PMF by the NMF:
MR = PMF / NMF
Money Flow Index (MFI): Calculate the MFI by using the formula: MFI = 100 – (100 / (1 + MR))
The MFI is normally between 0 and 100. A high MFI value (above 80) indicates an overbought situation, while a low MFI value (below 20) indicates an oversold situation.
Advantages of the Money Flow Index (MFI):
Cash flow measurement: The MFI helps to measure the cash flow into and out of an asset and can quantify buying or selling pressure.
Convergence or divergence: The MFI can be used to identify convergence or divergence between price movements and money flow, which can indicate potential reversals or continuations.
Easy to interpret: The signals from the MFI are easy to interpret. A high MFI value can indicate an overbought situation, while a low value indicates an oversold situation.
Disadvantages of the Money Flow Index (MFI):
False signals: As with many technical indicators, false signals can also occur with the MFI, especially if the market moves sideways or remains in a narrow range.
Lagged indicator: The MFI is a backward-looking indicator based on historical price and volume data. It cannot always react quickly to changing market conditions.
Practical application of the Money Flow Index (MFI):
An example of the application of the MFI is the use of its signals to place trades:
If the MFI value rises above 80, this could indicate an overbought situation and a trader could consider taking a short position.
If the MFI falls below 20, this could indicate an oversold situation and a trader might consider taking a long position.
Traders can also analyze the convergence or divergence between the MFI and the price trend to identify possible trend reversals or continuations. The MFI can be used as a confirmation for other technical indicators to make trading decisions. It is important to note that the MFI is most effective when used in conjunction with other analytical techniques and a comprehensive market analysis.

