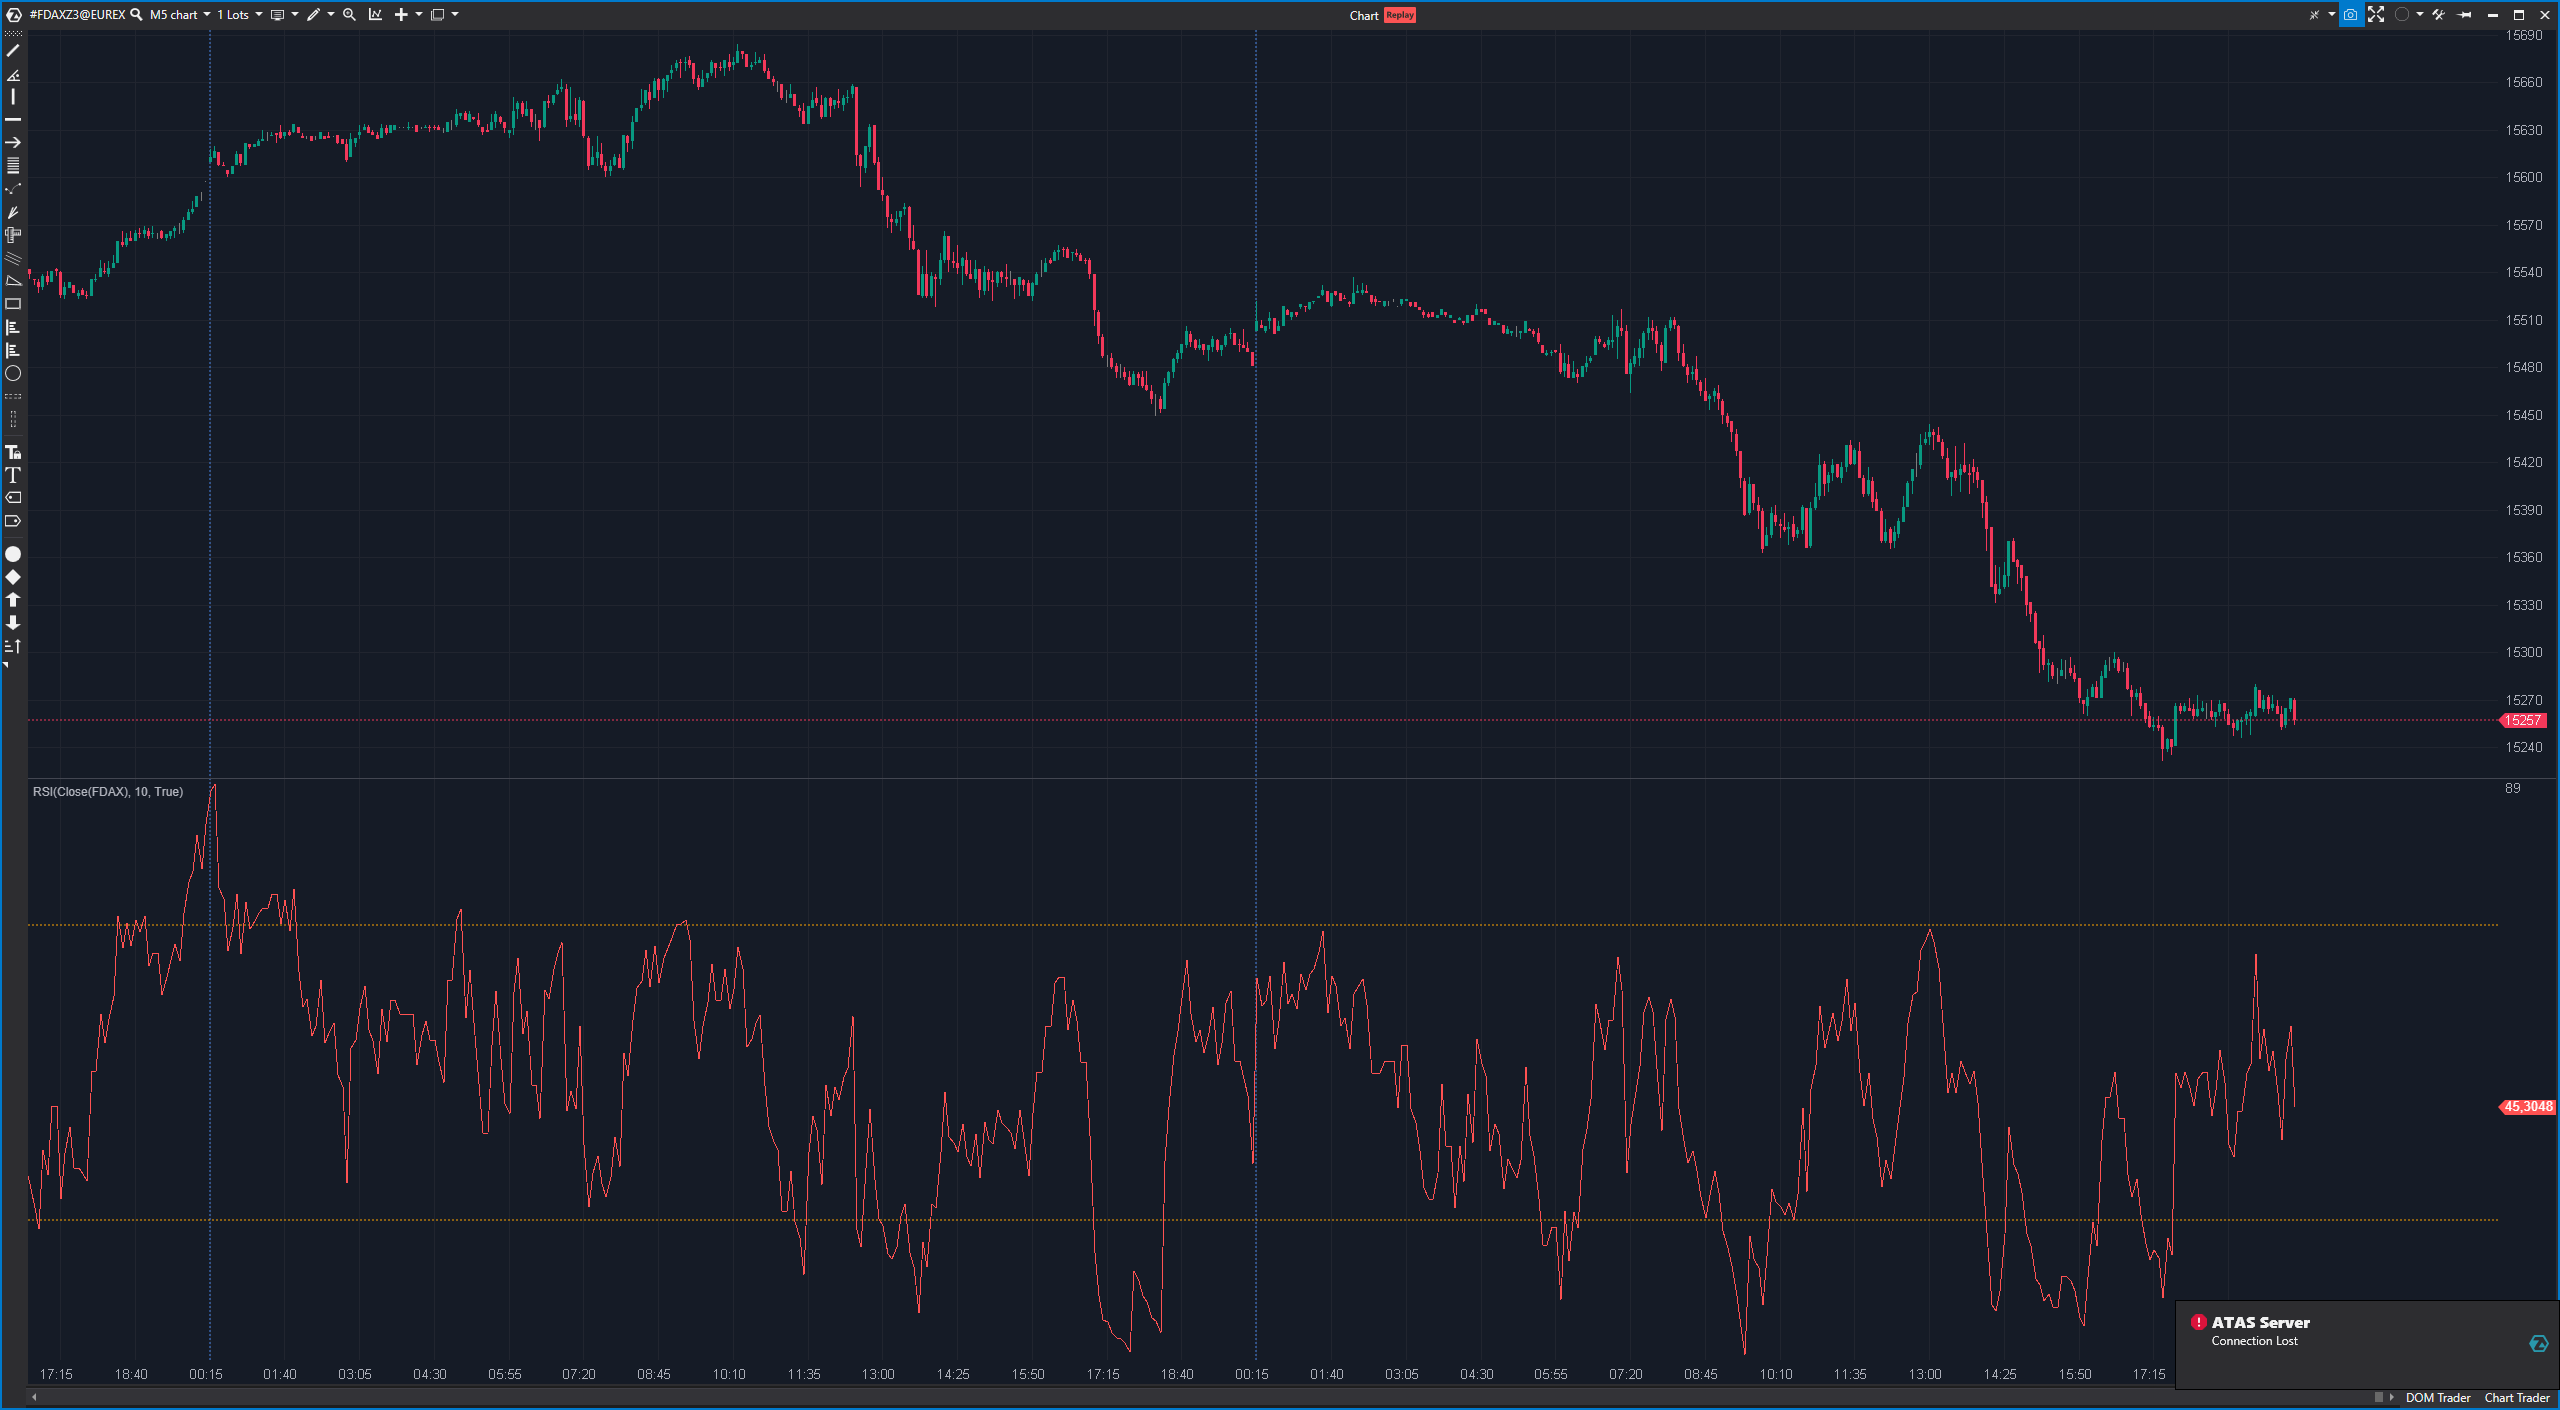
The Relative Strength Index (RSI) is a widely used technical indicator used in financial analysis to measure the strength and weakness of a market. The RSI ranges from 0 to 100 and is usually displayed on a chart below the price chart. It is based on the calculation of average gains and losses over a specified period and is often used to identify overbought or oversold conditions and potential trend reversals.
Calculation of the RSI:
- Calculate the average profit (AG) and average loss (AV) over a specified period (normally 14 periods). AG = (sum of profits in the last 14 periods) / 14
AV = (sum of losses in the last 14 periods) / 14 - Calculate the RS (Relative Strength) by dividing AG by AV: RS = AG / AV
- Calculate the RSI by using the following formula: RSI = 100 – (100 / (1 + RS))
Advantages of the Relative Strength Index (RSI):
- Measuring market strength: The RSI measures the strength of a market and helps to identify overbought and oversold conditions. Values above 70 are often considered overbought, while values below 30 are considered oversold.
- Divergence: RSI divergences, where the RSI and the price point in opposite directions, can indicate possible trend reversals.
- Simplicity: The RSI is easy to calculate and display on charts, which is why it is popular with many traders.
Disadvantages of the Relative Strength Index (RSI):
- False signals in strong trends: In strong upward or downward trends, the RSI can indicate overbought or oversold conditions without a trend reversal being imminent. This can lead to false signals.
- Time period dependency: The choice of time period for the RSI calculation can influence the signal quality. Too short a period can lead to too many signals, while too long a period reduces the sensitivity of the RSI.
Practical application of the Relative Strength Index (RSI):
An example of the use of the RSI is the identification of overbought and oversold conditions and the generation of buy and sell signals:
- Overbought conditions: When the RSI rises above 70, the market is often considered overbought, which could indicate a possible trend reversal. This could be a sell signal.
- Oversold conditions: When the RSI falls below 30, the market is often considered oversold, which could indicate a possible trend reversal. This could be a buy signal.
It is important to note that the RSI alone is not enough to make trading decisions. It should be used together with other indicators and a comprehensive market analysis. Traders can also check RSI divergences and the behavior of the RSI versus price to gain additional insight into the market direction.

