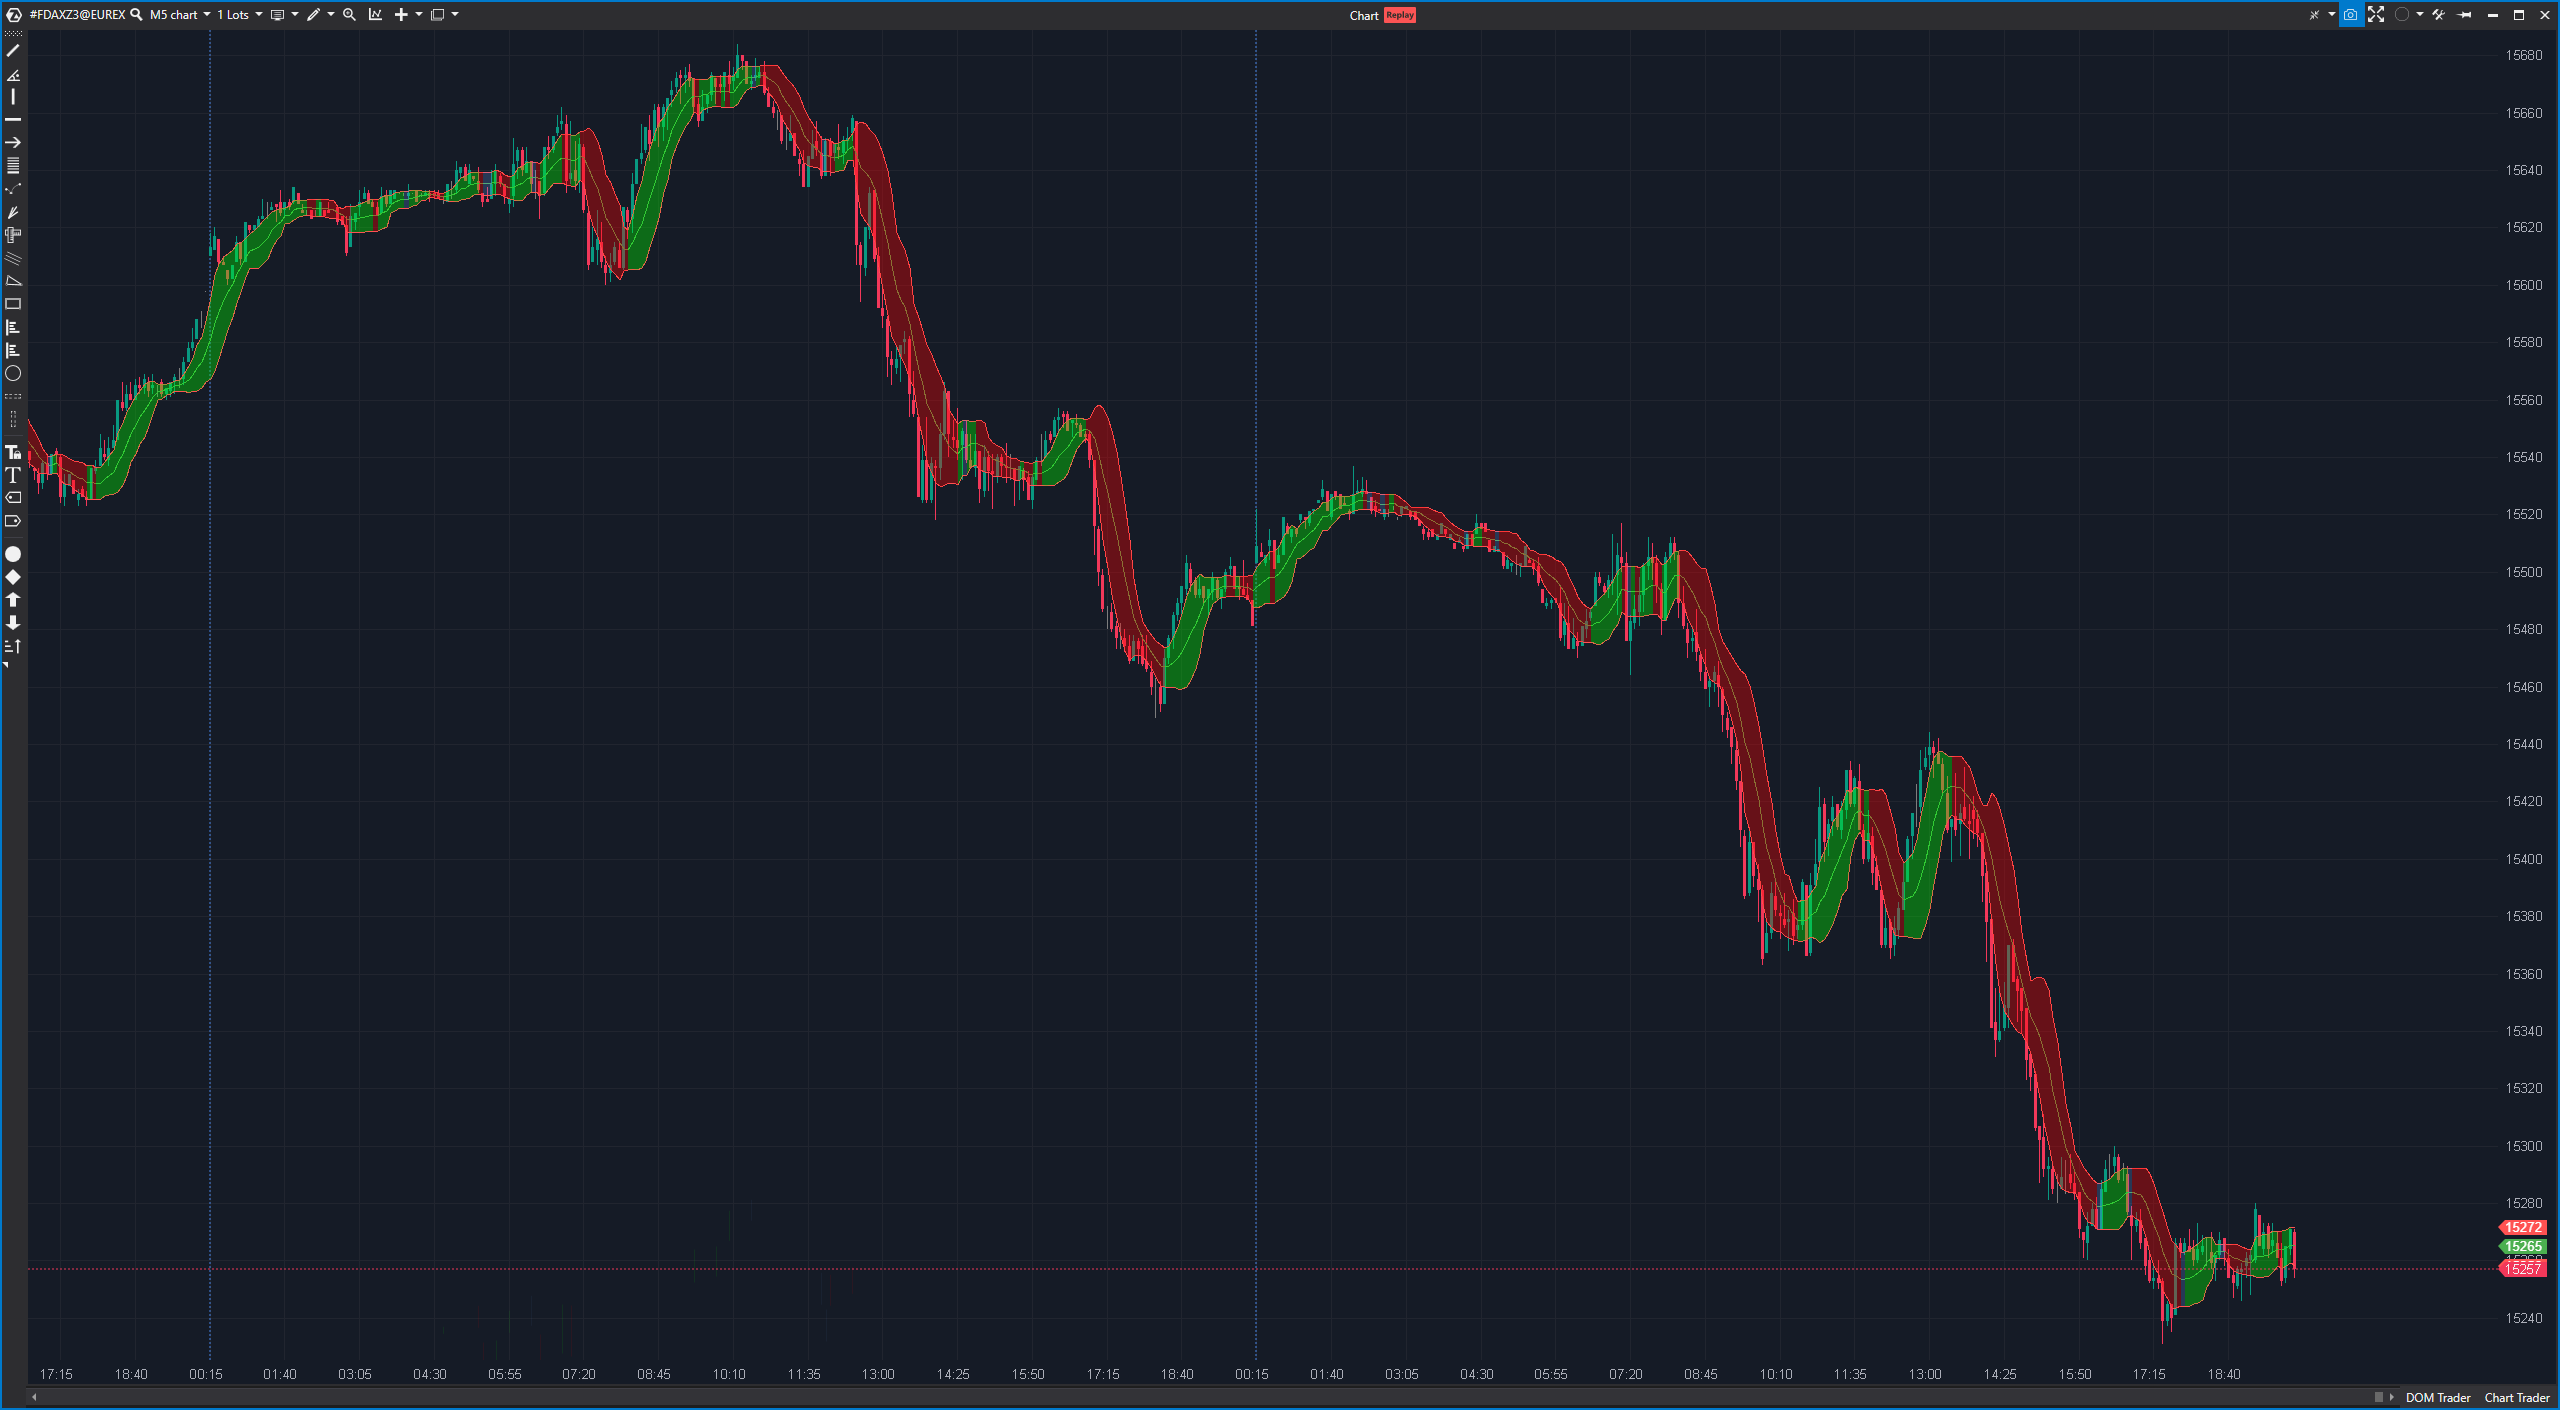
The Bollinger Bands are a popular technical indicator used in financial analysis to measure the volatility of a market and identify potential turning points in the price trend. The indicator consists of three main components:
- Simple Moving Average (SMA ): The Simple Moving Average (SMA) is a simple moving average over a certain period of time, usually set to 20 periods. It serves as a baseline and represents the average price over this period.
- Upper Bollinger band: The upper Bollinger band is calculated by multiplying the middle Bollinger band by the standard deviation of the price over the same period and then shifting it upwards by a factor (usually 2).
- Lower Bollinger band: The lower Bollinger band is calculated in a similar way to the upper Bollinger band, but shifted downwards by the same factor.
Advantages of Bollinger bands:
- Volatility measurement: Bollinger bands help to visualize the volatility of a market. If the bands are close together, this indicates low volatility, while bands that are far apart indicate high volatility.
- Support and resistance levels: The upper and lower Bollinger bands can serve as potential support and resistance levels at which the price can react.
- Recognize turning points: If the price touches or breaks through the upper or lower Bollinger bands, this can indicate possible turning points or trend reversals.
Disadvantages of the Bollinger Bands:
- Delayed signals: Bollinger Bands are lagging indicators because they are based on past price data. They may provide late signals and cannot always indicate future price movements at an early stage.
- False signals: In volatile markets, the Bollinger bands can be extended and the price can touch the bands more frequently, which can lead to false signals.
Practical application of the Bollinger Bands:
An example of the use of Bollinger Bands is the use of price touches or breaches of the bands to generate trading signals:
- Touching the upper Bollinger band: A touch or break of the upper Bollinger band can be considered a sell signal as it indicates a possible overbought situation.
- Touching the lower Bollinger band: A touch or break of the lower Bollinger band can be considered a buy signal as it indicates a possible oversold situation.
Traders can also analyze the width of the Bollinger Bands to assess the volatility of the market. A sudden widening of the bands could indicate an imminent strong price movement.
It is important to note that Bollinger Bands should be used in conjunction with other technical indicators and a comprehensive market analysis. They alone should not be used for trading decisions. Traders should also apply risk management principles to minimize losses.

