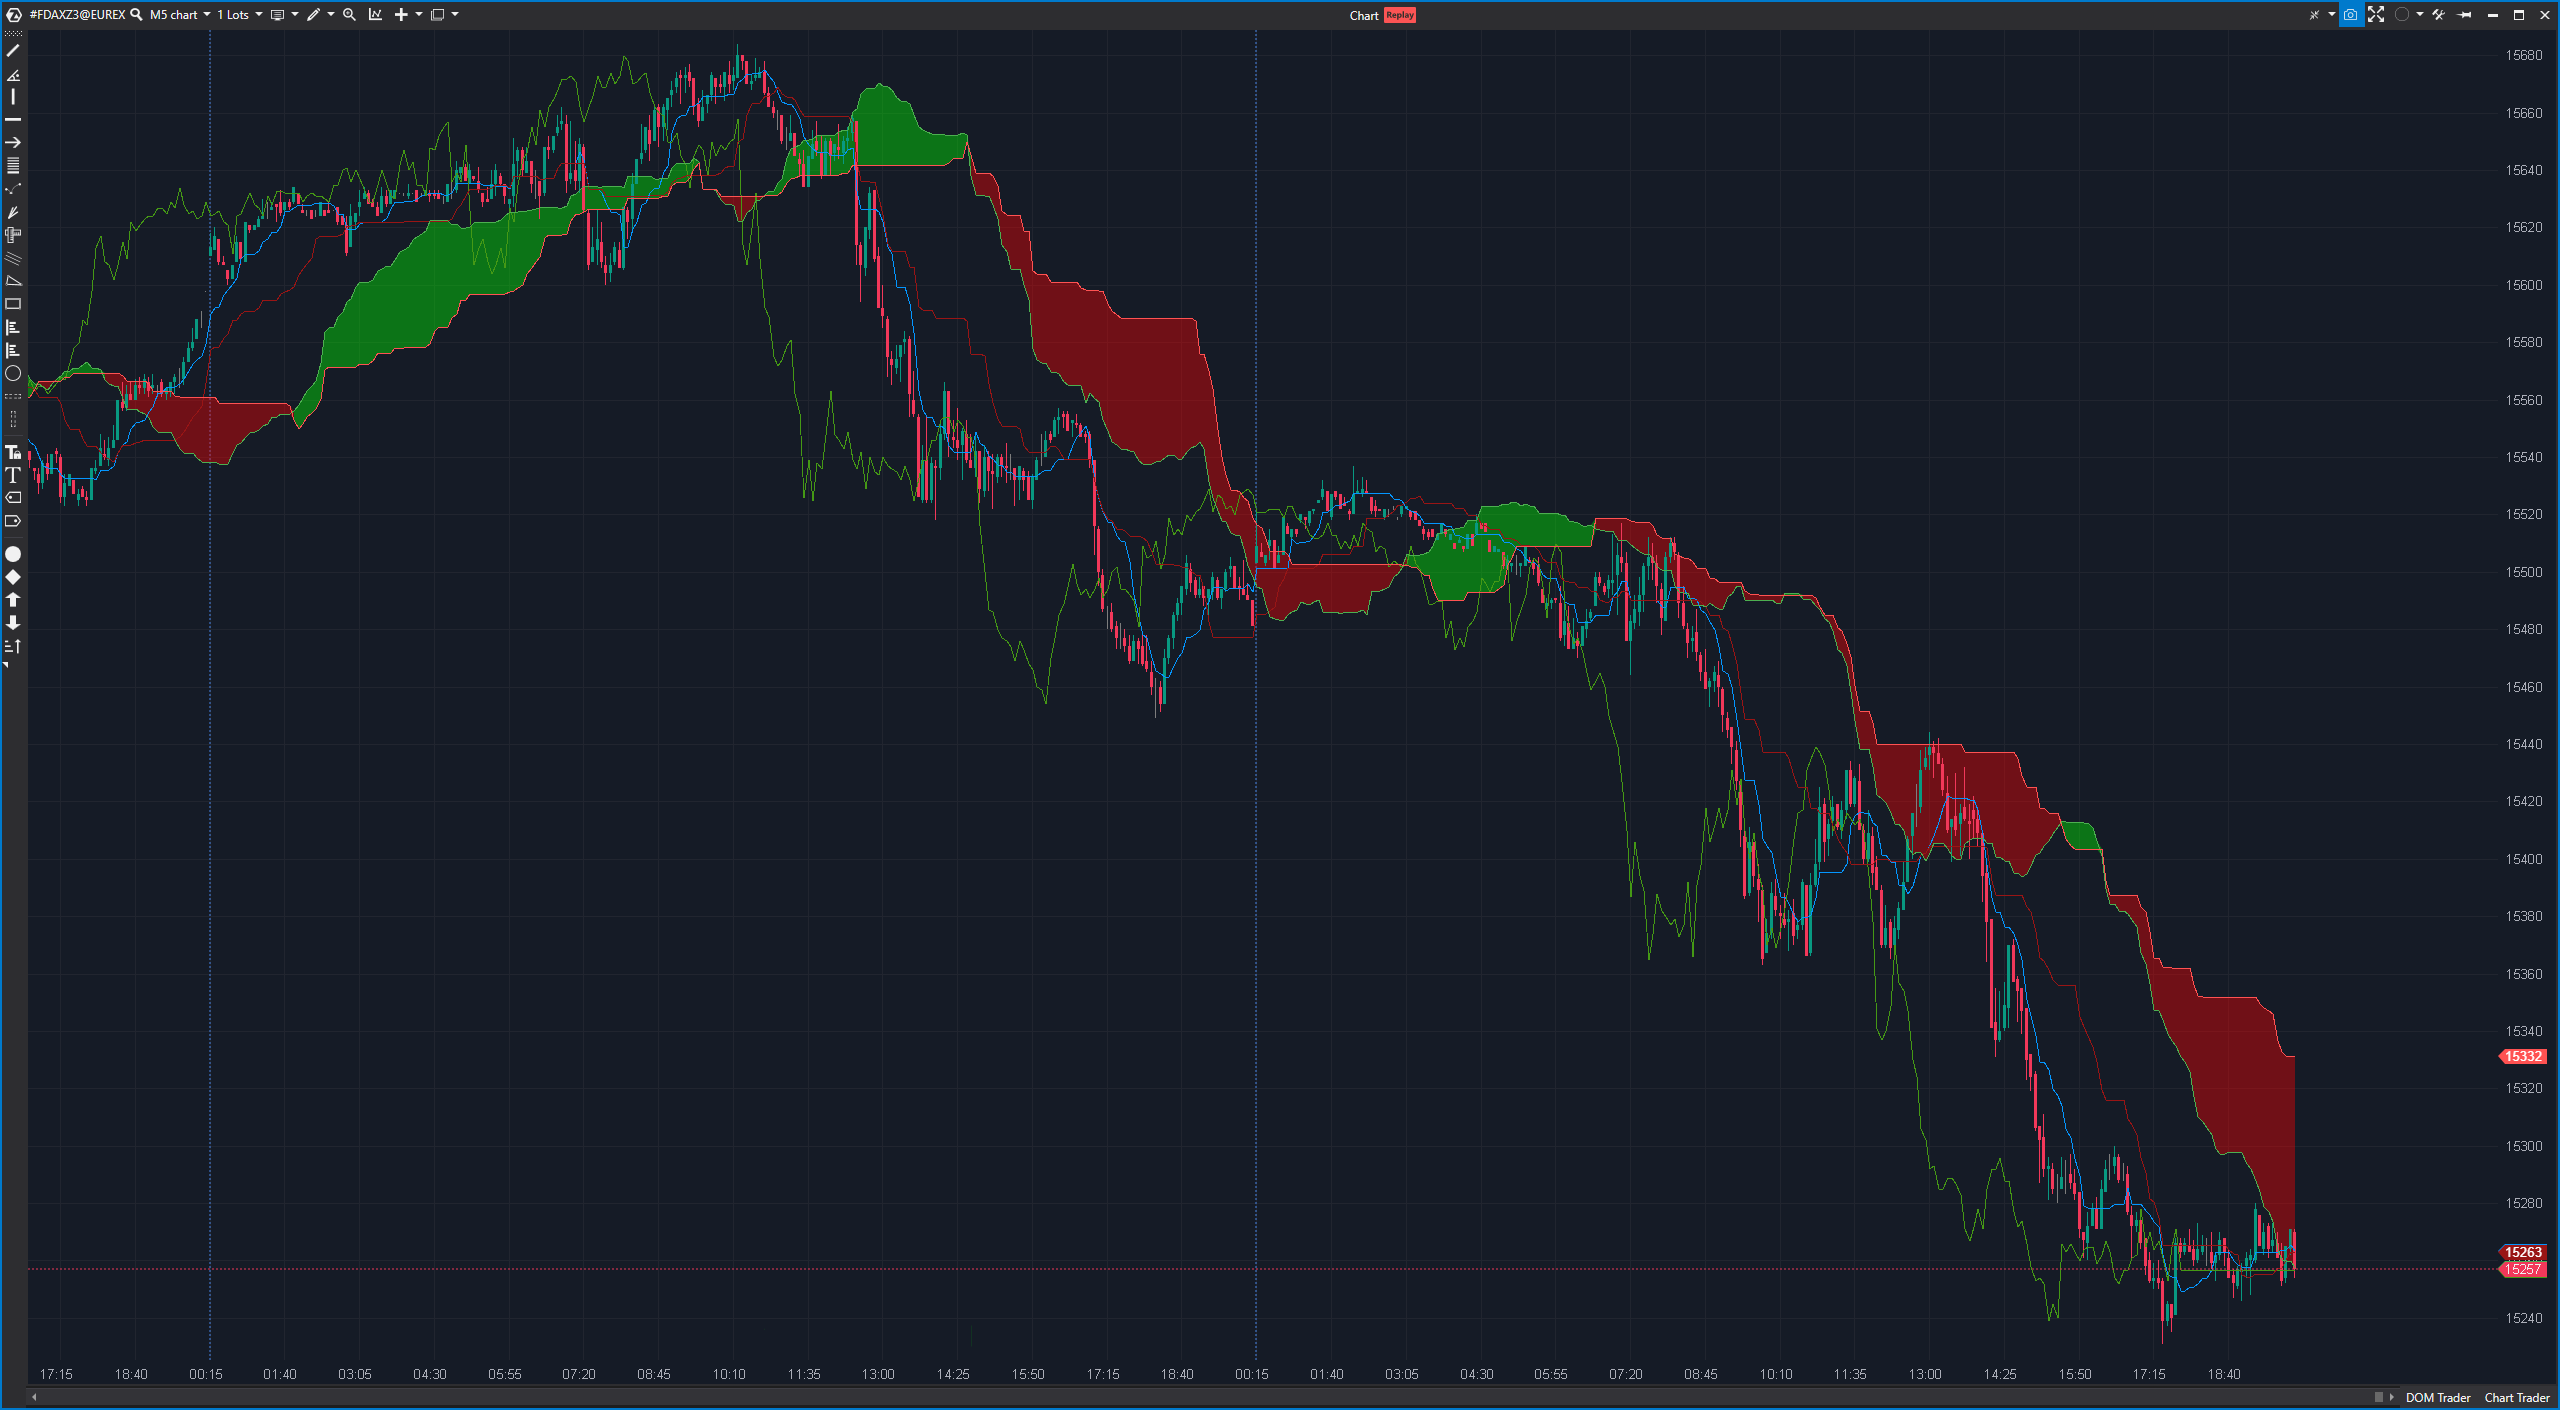
The Ichimoku Cloud indicator, also known as Ichimoku Kinko Hyo, is a comprehensive technical indicator developed by Goichi Hosoda in the 1930s. This indicator provides a wide range of information and is used to display support and resistance levels, trend direction and momentum in a single chart. The Ichimoku indicator consists of several components, including:
- Tenkan-Sen (reversal line): This is the fastest line and is often shown as a red line. It represents the average of the highest and lowest prices of the last nine periods.
- Kijun-Sen (baseline): The baseline is slower and is often shown as a blue line. It represents the average of the highest and lowest prices over the last 26 periods.
- Senkou Span A (reversal span A): This line forms the upper limit of the “cloud” (Kumo) and is often shown as a green line. It is calculated by averaging the Tenkan-Sen and the Kijun-Sen and then projecting 26 periods into the future.
- Senkou Span B (reversal span B): This line forms the lower limit of the cloud and is often shown as a red line. It is calculated by averaging the highest and lowest prices of the last 52 periods and then projecting 26 periods into the future.
- Kumo (cloud): The cloud is filled between Senkou Span A and Senkou Span B and serves as an area of support and resistance. The color of the cloud changes depending on the direction of the trend.
Advantages of the Ichimoku Cloud indicator:
- Holistic analysis: The Ichimoku indicator provides a comprehensive analysis that shows trend direction, support and resistance, momentum and reversal points in a single chart.
- Clear signals: The crossing of the Tenkan-Sen and Kijun-Sen can generate buy or sell signals, and the position of the price data in relation to the cloud can provide confirming signals.
- Objectivity: The Ichimoku indicator is objective and does not require any subjective interpretation of price movements.
Disadvantages of the Ichimoku Cloud indicator:
- Complexity: The Ichimoku indicator is complex at first glance and can be difficult for beginners to understand.
- Time consuming: Reading and analyzing the Ichimoku indicator can be time consuming, especially if you combine it with other indicators.
Practical application of the Ichimoku Cloud indicator:
An example of the application of the Ichimoku indicator is the use of crossings between the Tenkan-Sen and Kijun-Sen to generate trading signals:
- Bullish signal: If the Tenkan-Sen crosses the Kijun-Sen from bottom to top, this could be interpreted as a bullish signal.
- Bearish signal: If the Tenkan-Sen crosses the Kijun-Sen from top to bottom, this could be interpreted as a bearish signal.
Traders can also analyze the position of the price in relation to the cloud. If the price is above the cloud, this is often considered bullish, while a price below the cloud is considered bearish.
It is important to note that the Ichimoku indicator is most effective when used in conjunction with other analytical techniques and a comprehensive market analysis. Traders should also apply risk management principles and use stop-loss orders to limit losses.

