The Keltner Channel (also referred to as “Keltner Bands” or “Keltner Channel”) is a technical indicator in financial analysis used to measure the volatility of an asset and identify potential support and resistance levels. The Keltner channel is similar to the Bollinger bands, but differs in the way the bandwidth is calculated.
How the Keltner channel works:
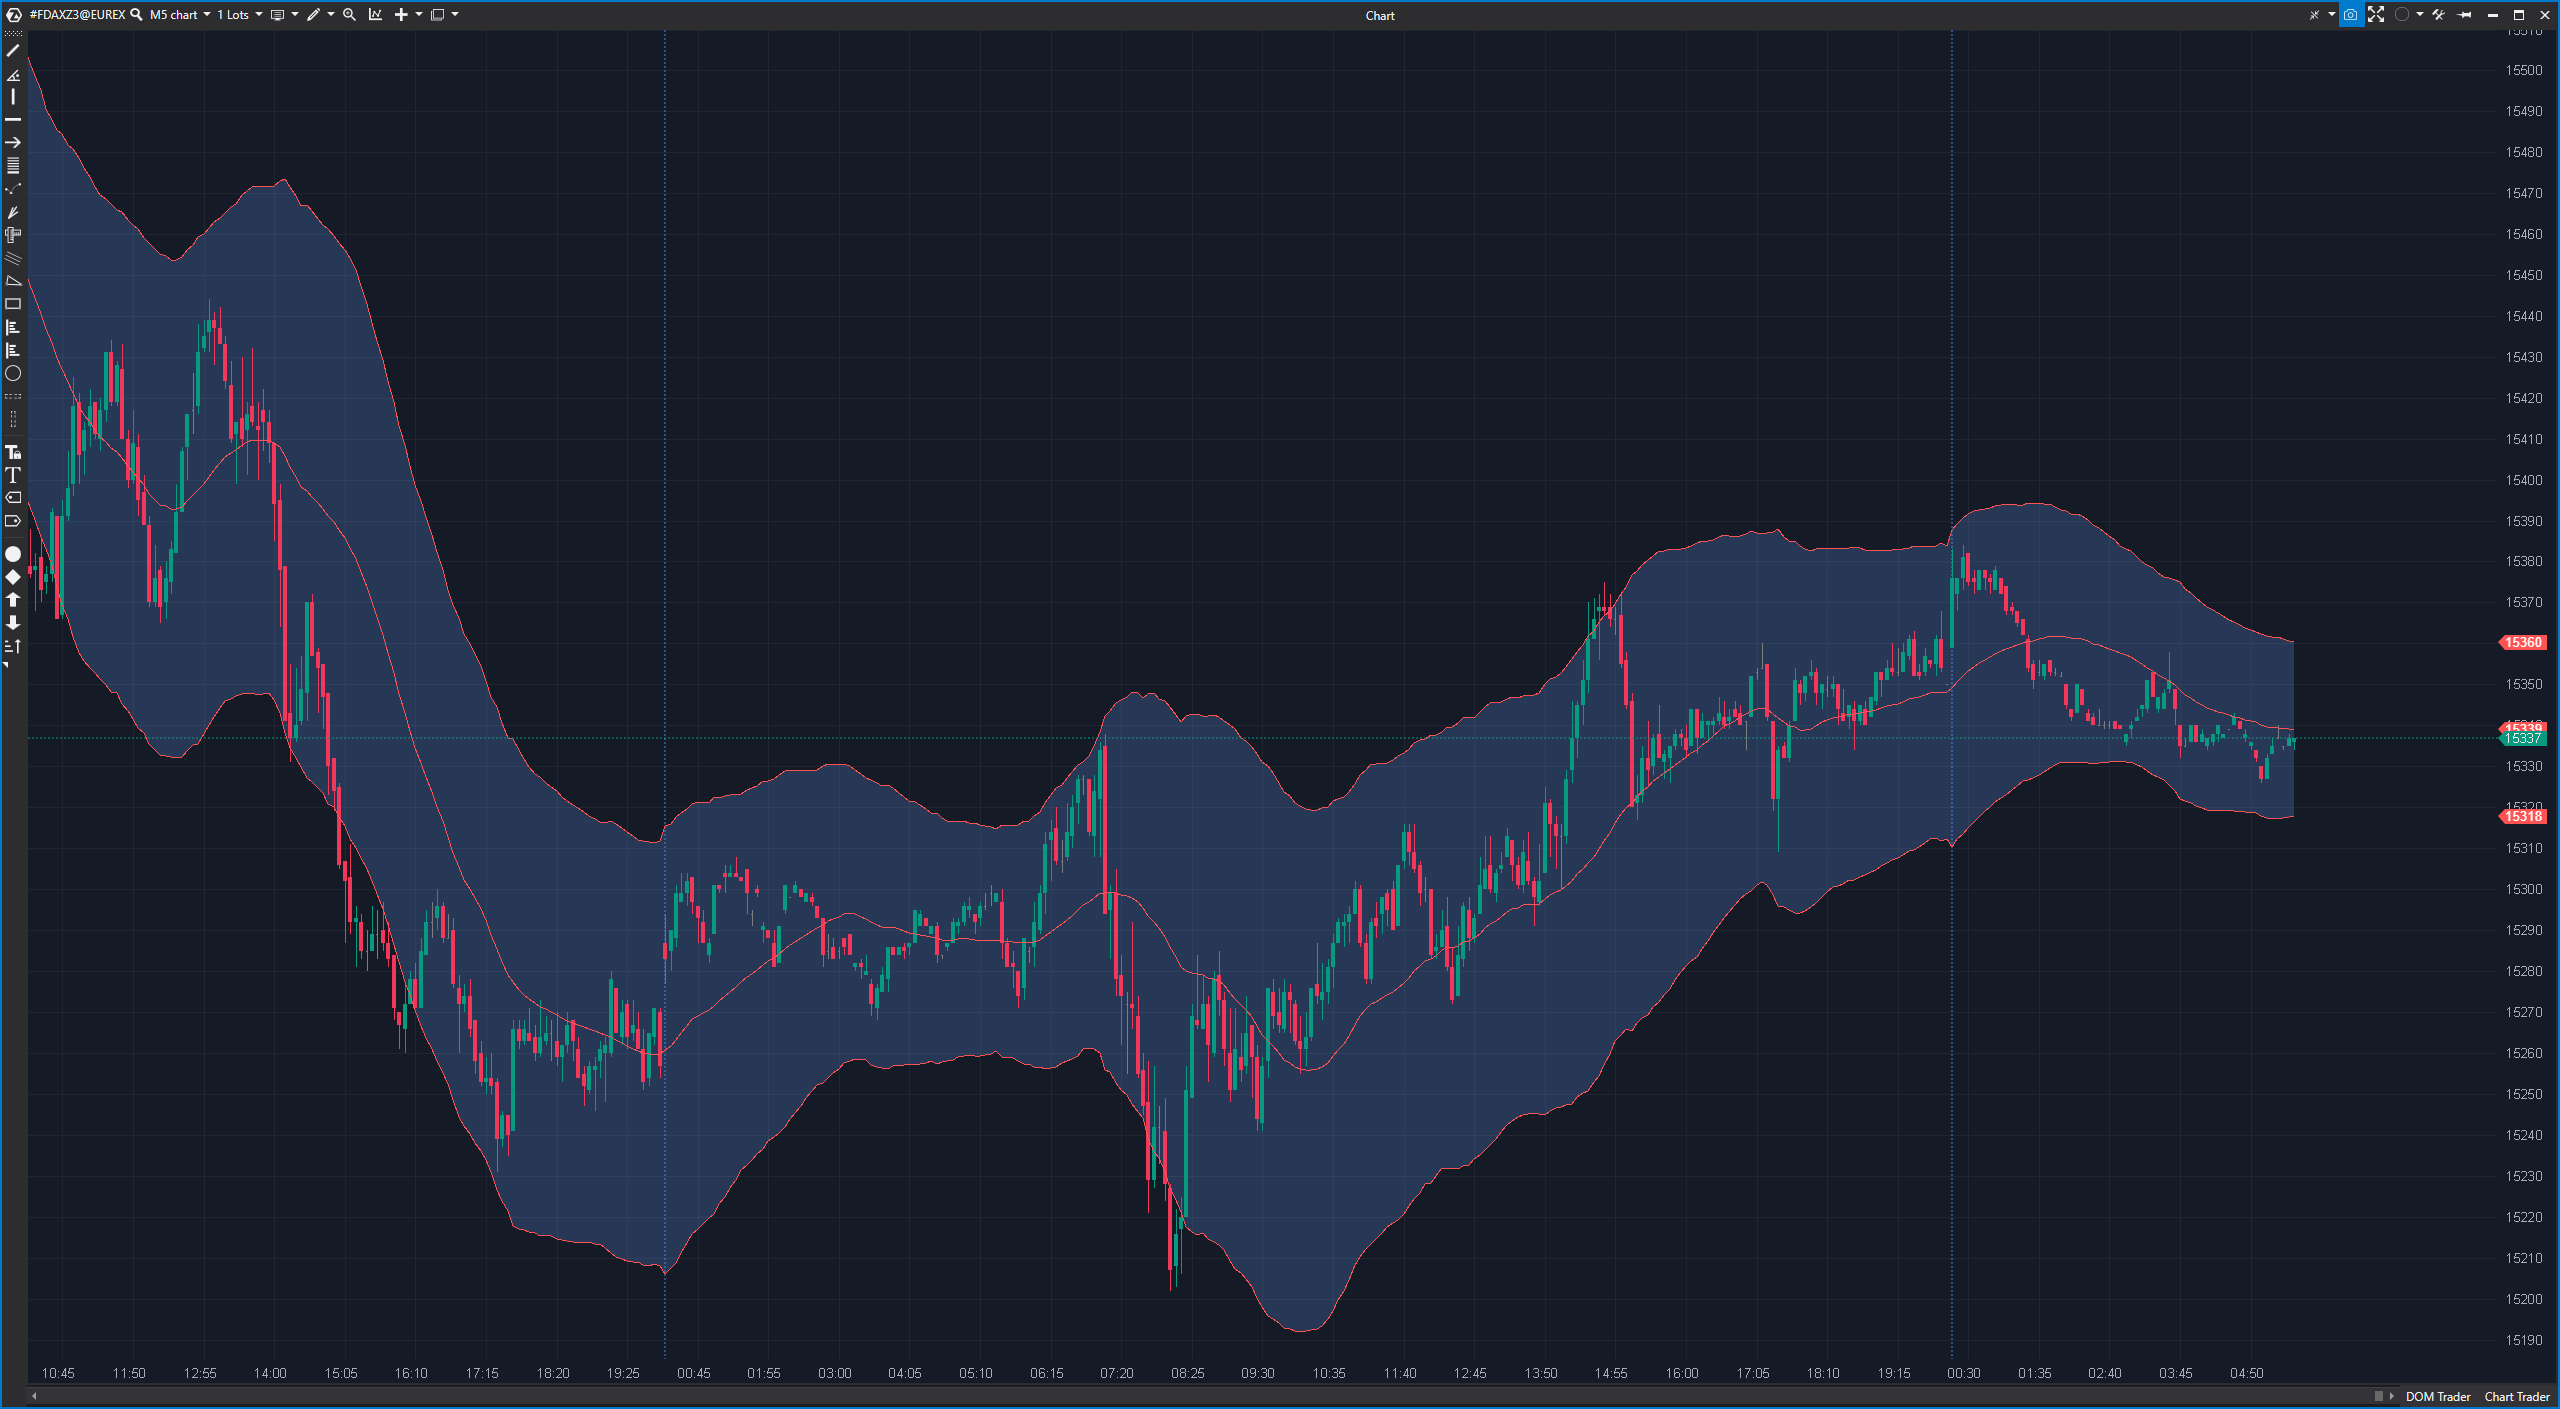
The Keltner channel consists of three main components:
- Midline (EMA): The midline is usually an exponential moving average (EMA) of the closing prices of the asset over a certain period of time.
- Upper line (EMA + multiplier x true range): The top line is calculated by adding a multiplier (usually 2 or 2.5) to the center line, multiplied by the true range (the difference between the high and low of the asset or the high and close of the previous day, whichever is greater).
- Bottom line (EMA – multiplier x true range): The bottom line is calculated by subtracting the multiplier multiplied by the True Range from the center line.
Advantages of the Keltner channel:
- Measuring volatility: The Keltner channel helps to quantify the volatility of an asset and can help to identify periods of high and low volatility.
- Support and resistance levels: The upper and lower lines of the Keltner channel serve as potential support and resistance levels. The price may tend to move within these bands.
- Trend confirmation: A break above the upper line may indicate a possible continuation of the uptrend, while a break below the lower line may indicate a possible continuation of the downtrend.
Disadvantages of the Keltner channel:
- False signals: As with many technical indicators, false signals can occur, especially when the market is moving sideways or is in a narrow range.
- Customize settings: Choosing the right settings for the Keltner channel, including the time period for the EMA and the multiplier, can be subjective and may require adjustments depending on market conditions.
Practical application of the Keltner channel:
An example of the application of the Keltner channel is the use of the bandwidth between the upper and lower line to prepare for upcoming breakouts:
- If the range narrows and the market enters a phase of low volatility, this may indicate an imminent breakout. Traders could open positions if the price breaks out of this narrow range.
- If the price breaks through the upper line, this could be a bullish signal, while a break of the lower line could be a bearish signal.
It is important to note that the Keltner channel is most effective when used in conjunction with other technical indicators and comprehensive market analysis. Traders should also apply risk management principles to minimize losses and adjust the specific settings of the indicator depending on the trading strategy and market conditions.