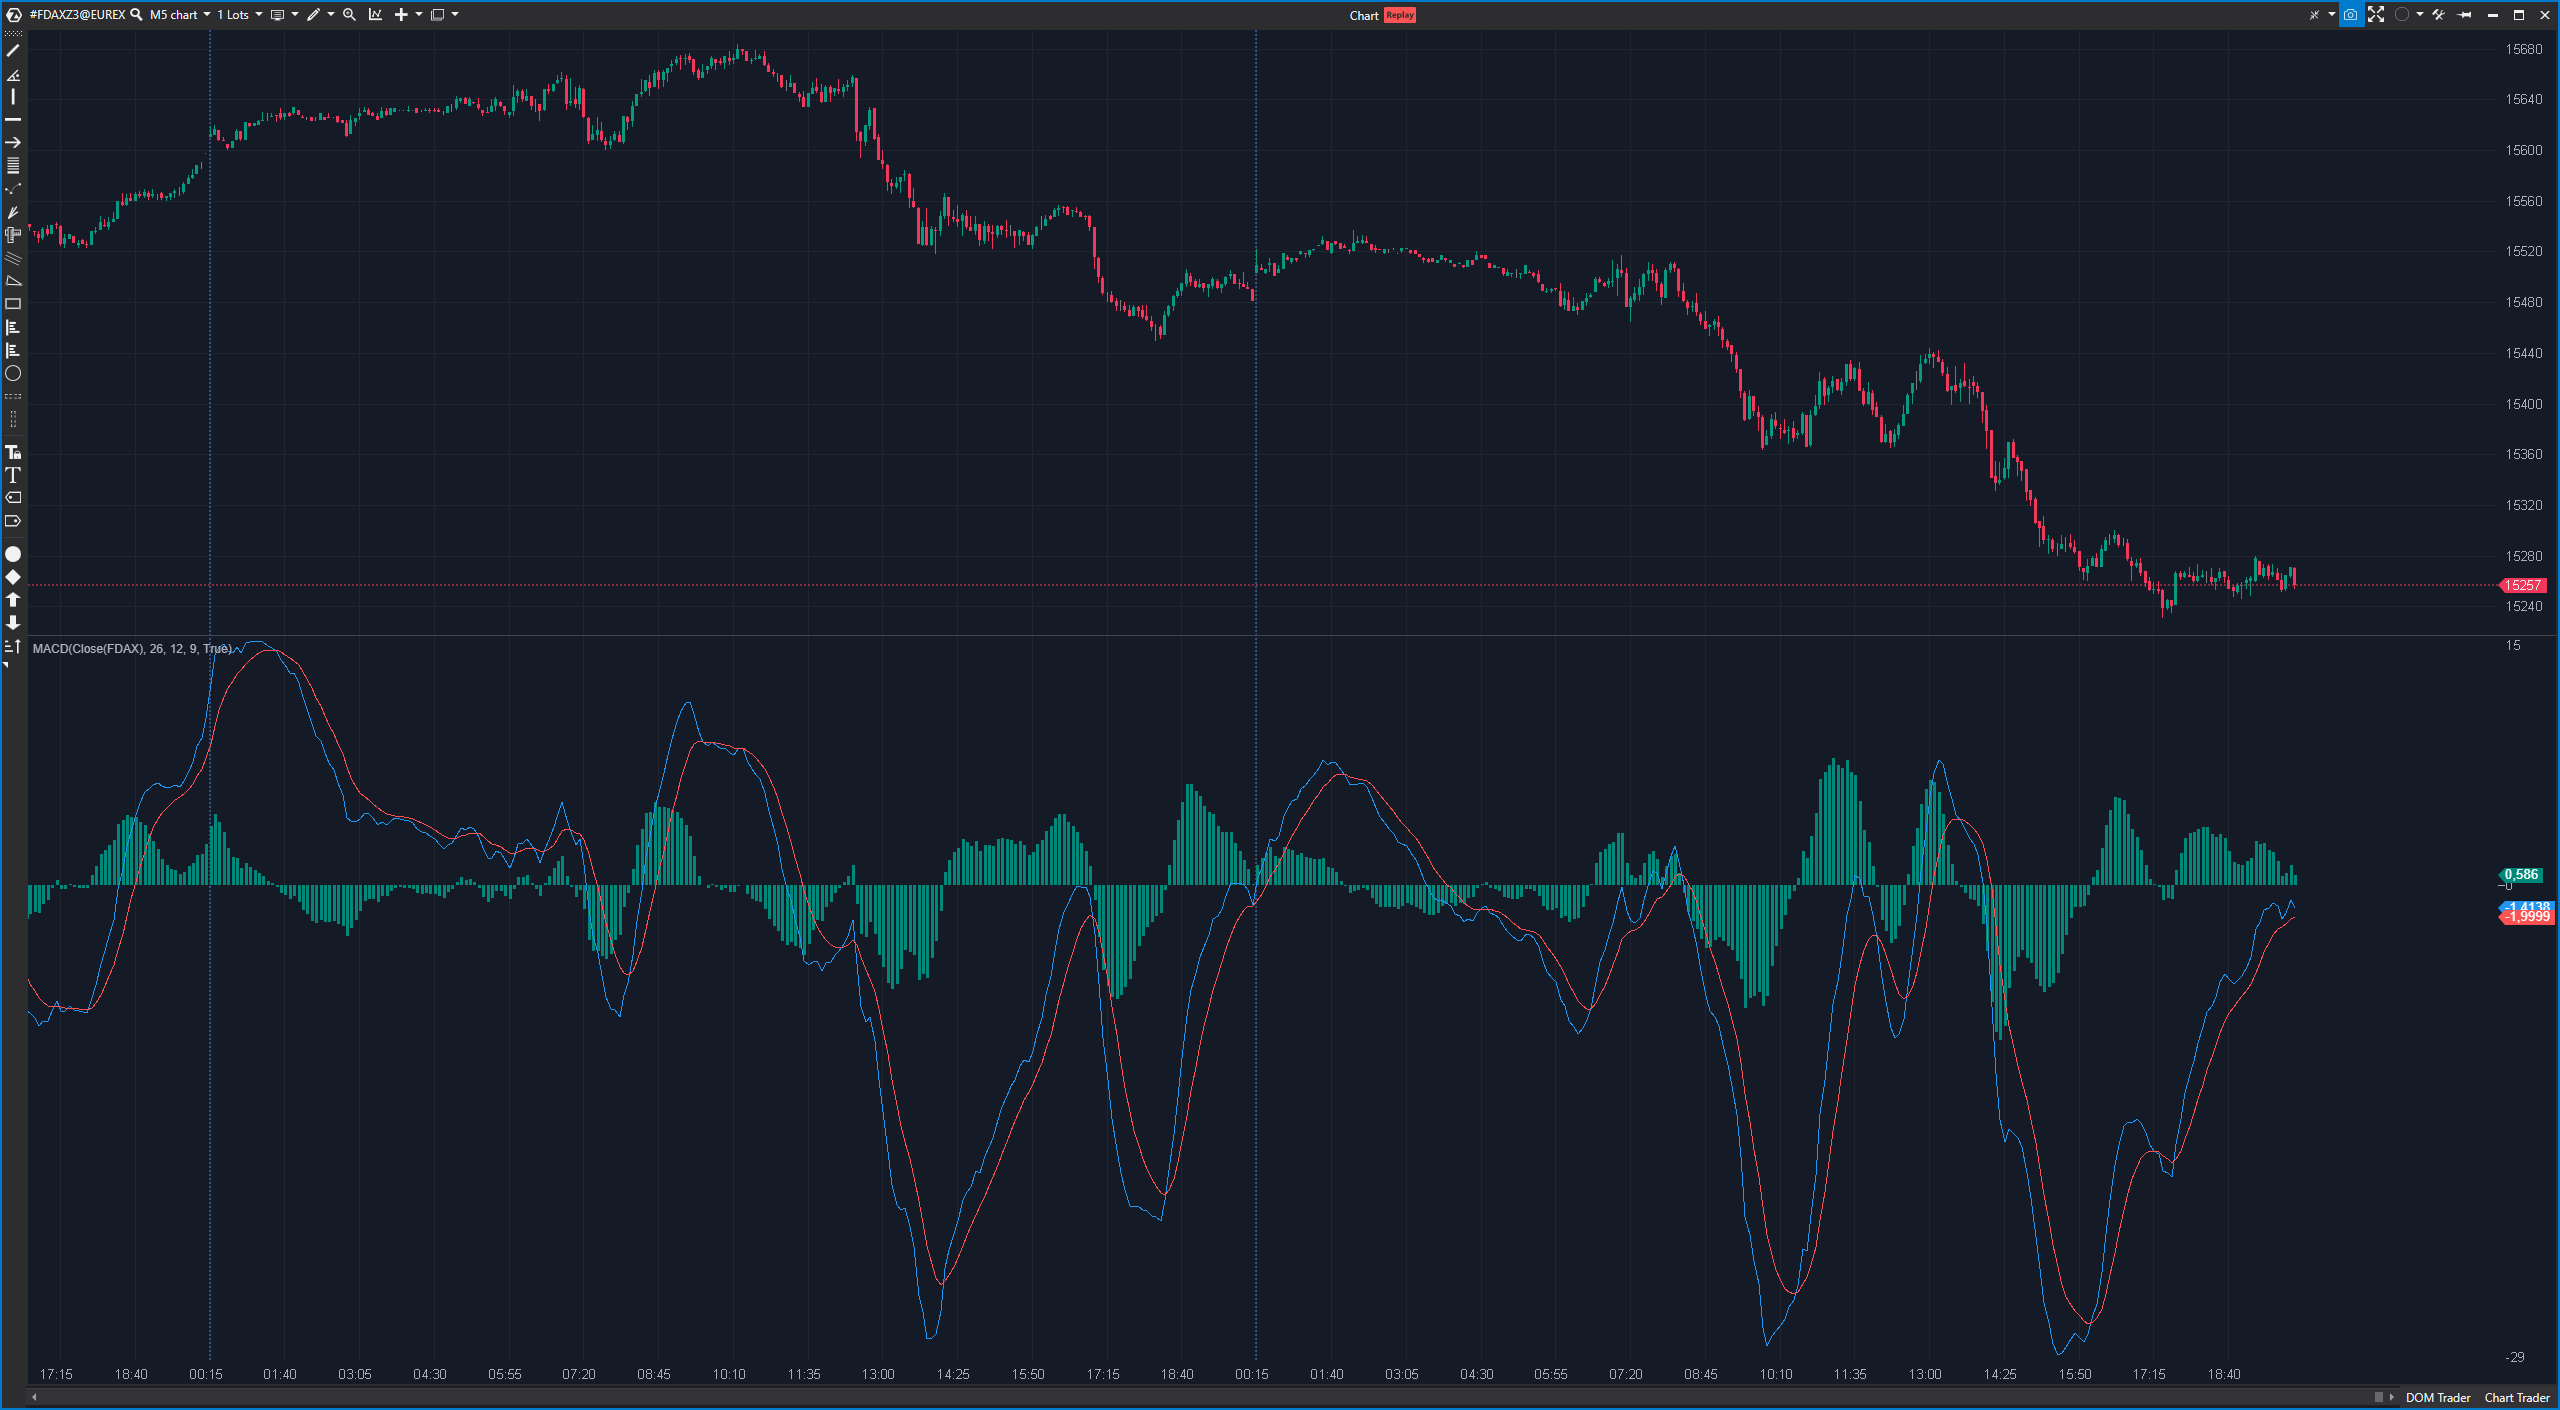
The Moving Average Convergence Divergence (MACD) is a popular technical indicator used in the technical analysis of financial markets to identify trends and trend reversals. The MACD consists of several lines and has two main components: the MACD line and the signal line.
Here is an explanation of the two main components of the MACD and how it is calculated:
- MACD line: The MACD line is calculated by subtracting the 26-day exponential moving average (EMA) from the 12-day EMA. This results in the MACD line. The MACD line is an oscillating line and shows the difference between these two EMAs.
- Signal line: The signal line is a 9-day EMA of the MACD line. The signal line is a smoother line that indicates the course of the MACD line.
- Histogram: The histogram is the difference between the MACD line and the signal line. It is usually displayed below the main chart and shows the strength and direction of the MACD.
Advantages of the Moving Average Convergence Divergence (MACD):
- Trend identification: The MACD can be used to identify trends and trend reversals. A positive histogram indicates an upward trend, while a negative histogram indicates a downward trend.
- Divergences: Divergences between the price and the MACD can indicate potential trend reversals.
- Signal generation: Crossings between the MACD line and the signal line can provide buy or sell signals.
Disadvantages of the Moving Average Convergence Divergence (MACD):
- False signals: The MACD can generate false signals in sideways markets. This can lead to traders receiving inaccurate signals.
- Lagging Indicator: The MACD is based on past price data and is therefore a lagging indicator that does not always react quickly to current market conditions.
Practical application of the Moving Average Convergence Divergence (MACD):
An example of the application of the MACD is the use of crossings between the MACD line and the signal line to generate trading signals:
- Bullish signal: If the MACD line crosses the signal line from bottom to top, this is often considered a bullish signal and could indicate a possible buy.
- Bearish signal: If the MACD line crosses the signal line from top to bottom, this is often considered a bearish signal and could indicate a possible sell-off.
Traders can also analyze the size and direction of the histogram to assess the strength of the trend. A rising histogram indicates an increasing trend, while a falling histogram may indicate a decreasing trend.
It is important to note that the MACD should be used in conjunction with other indicators and a comprehensive market analysis. The MACD alone may not be sufficient to make trading decisions. Traders should also consider risk management and use stop-loss orders to limit losses.