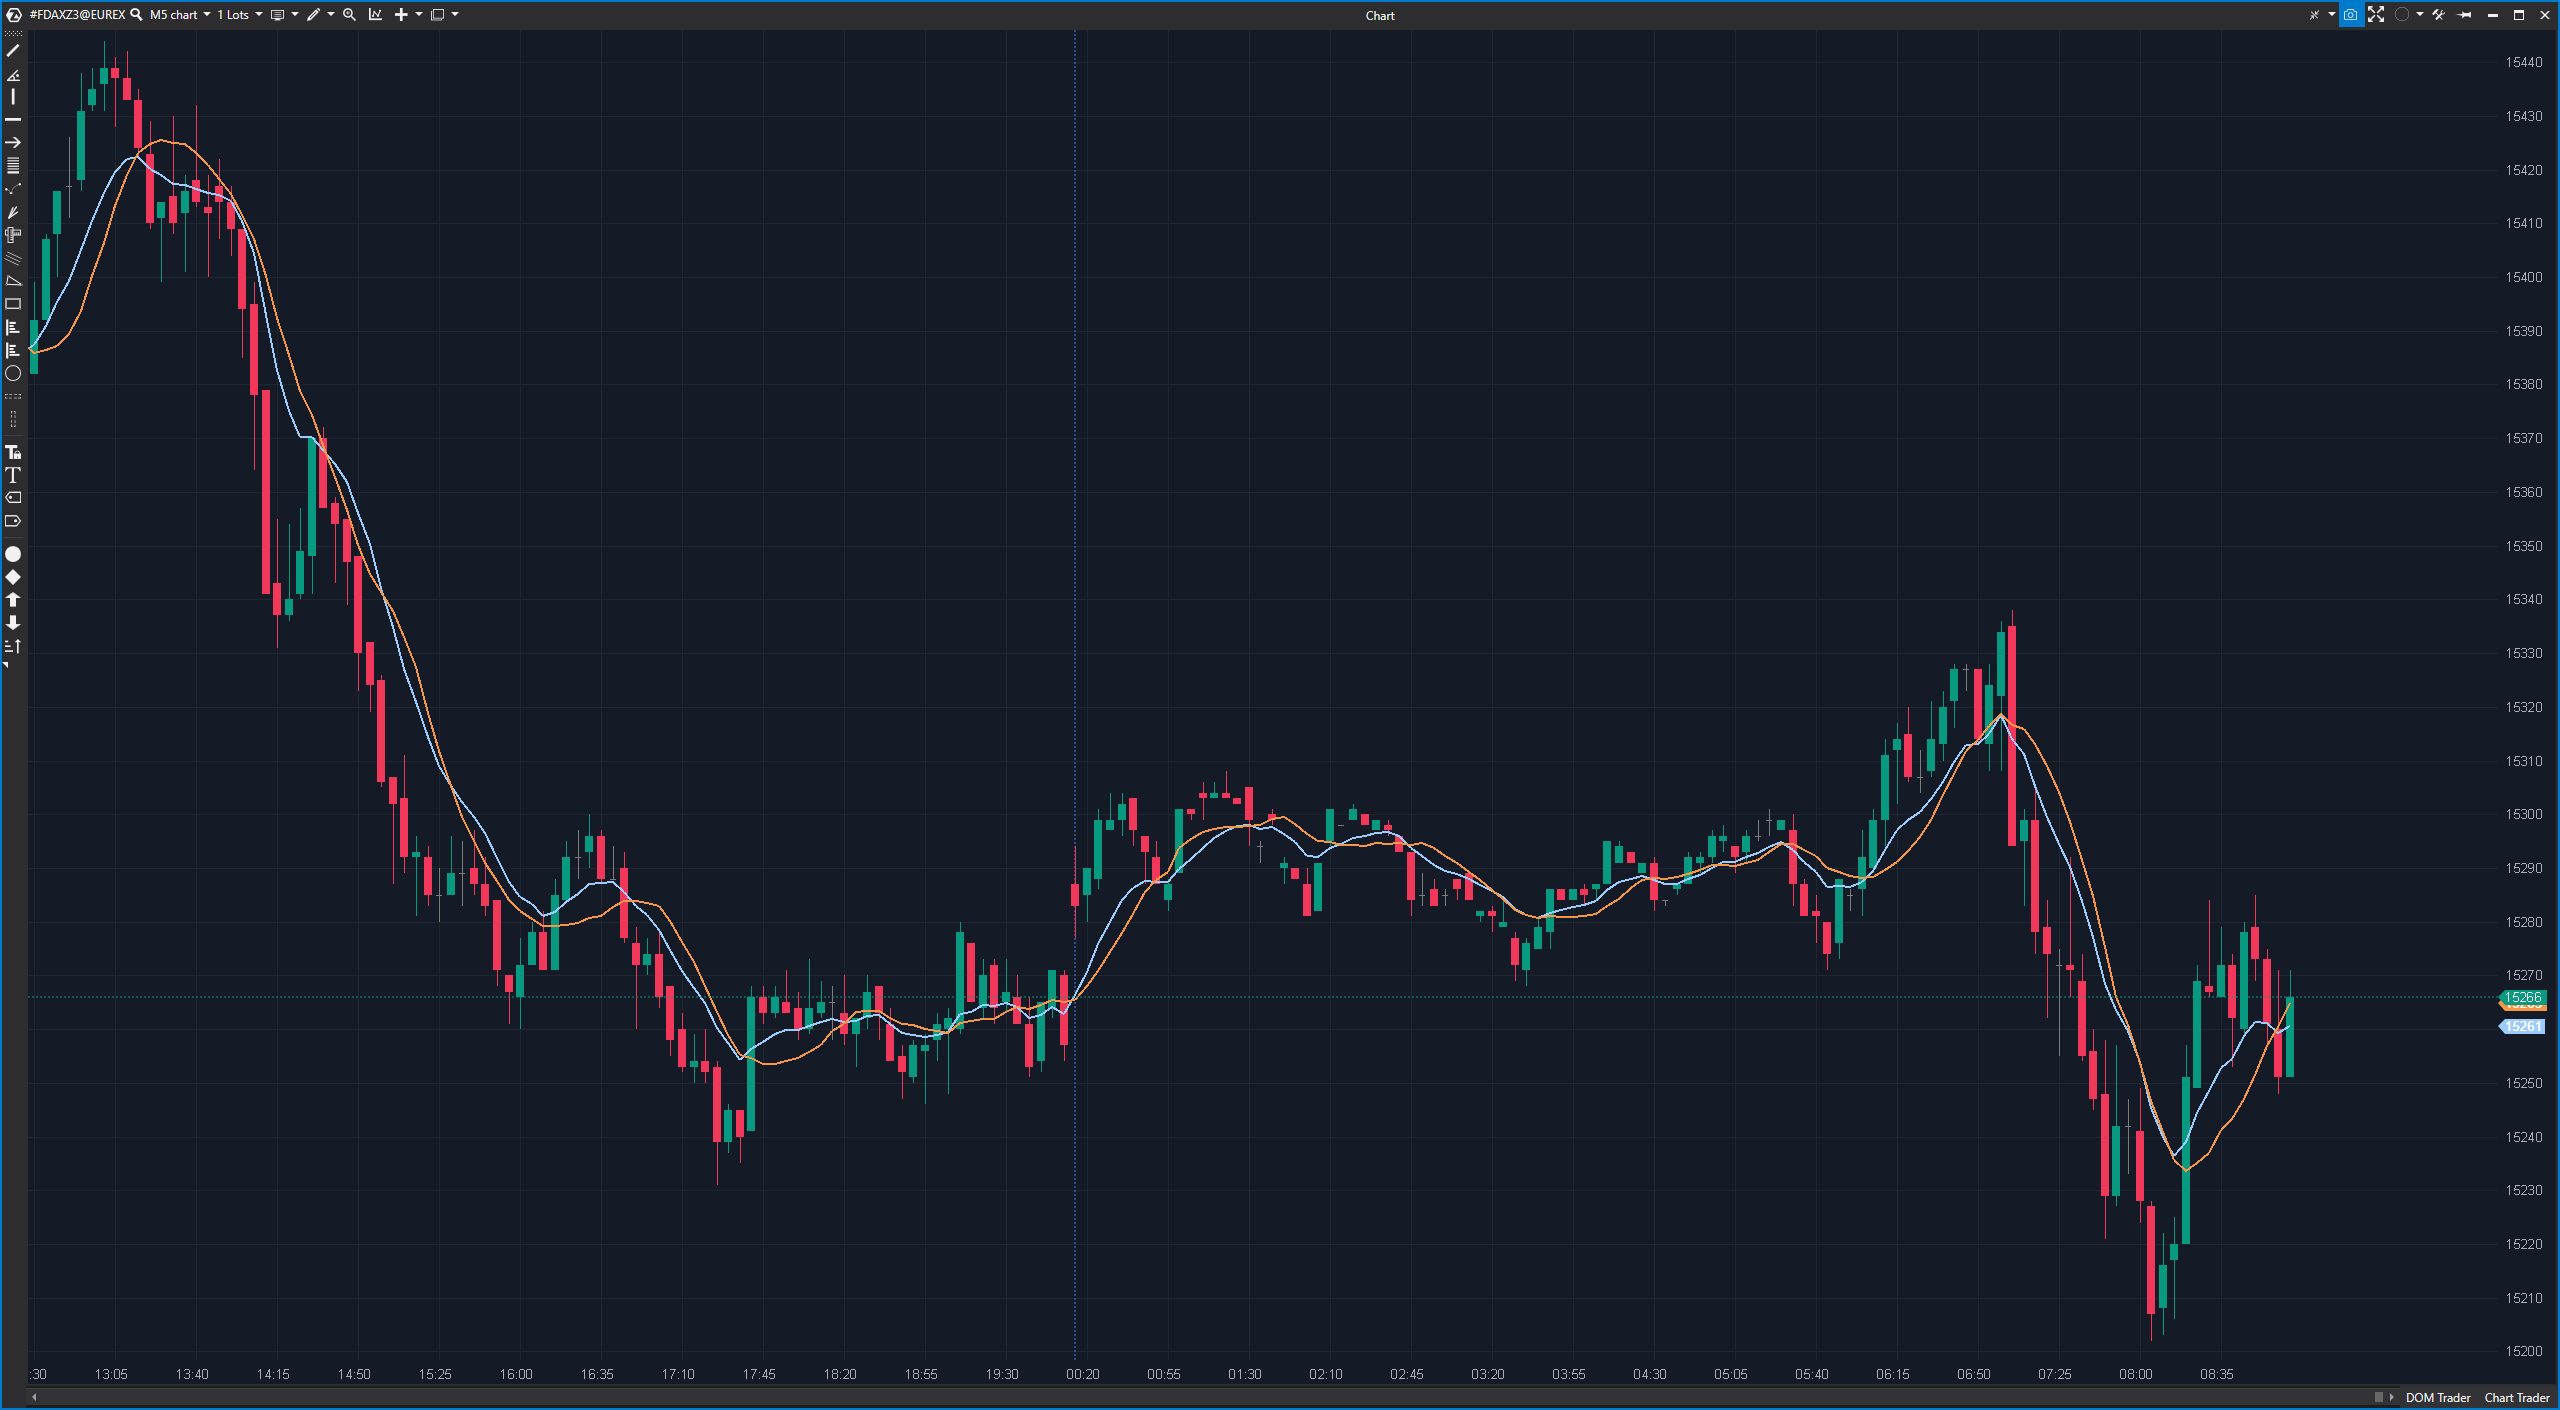
The moving average (MA) is a basic technical indicator that is widely used in financial analysis. The moving average smoothes price data over a period of time to identify trends, reduce volatility and determine potential support and resistance levels.
There are two main types of moving averages:
- Simple Moving Average (SMA): The SMA calculates the average of the closing prices over a specified period and weights all values equally.Formula for the SMA: SMA = (sum of closing prices over the period) / (number of periods)
- Exponential Moving Average (EMA): The EMA gives more weight to the most recent closing prices, which makes it react more quickly to current price changes; the formula for the EMA is more complex and takes into account the weight of the current period: EMA = (closing price – EMA of the previous day) x (2 / (1 + period)) + EMA of the previous day
Advantages of the moving average:
- Trend identification: The MA helps to identify trends by showing the average price over a certain period of time. An ascending MA indicates an upward trend, while a descending MA indicates a downward trend.
- Smoothing volatility: The MA smoothes short-term price fluctuations, which helps to reduce noise and false signals.
- Support and resistance levels: MAs can serve as potential support and resistance levels at which the price can react.
Disadvantages of the moving average:
- Lagging Indicator: The MA is a lagging indicator, which means that it is based on past price data. It therefore does not react as quickly to current market conditions as some other indicators.
- False signals in sideways markets: In a sideways market, the MA can generate false signals as it does not react well to price movements without a clear trend.
Practical application of the moving average:
A common example of the use of the moving average is the use of a long-term and a short-term MA in combination to generate trading signals. For example, you could use a 50-day SMA (short-term) and a 200-day SMA (long-term) on a stock chart.
- Golden cross: A “golden cross” occurs when the short-term MA crosses the long-term MA from bottom to top. This can be interpreted as a buy signal, as it indicates a possible upward trend.
- Death cross: A “death cross” occurs when the short-term MA crosses the long-term MA from top to bottom. This can be interpreted as a sell signal, as it indicates a possible downward trend.
The choice of time period for the MAs depends on your trading strategy and preferences. Shorter time frames react more quickly to price movements, while longer time frames tend to represent smoother and more long-term trends. It is important to use the MA in conjunction with other indicators and comprehensive analysis to make informed trading decisions.
Leave a Reply