The Parabolic SAR (Stop and Reverse) is a technical indicator developed by Welles Wilder and used in financial analysis to identify potential reversal points in the price of an asset. This indicator is often used to set stop-loss levels and is particularly popular with trend-following traders.
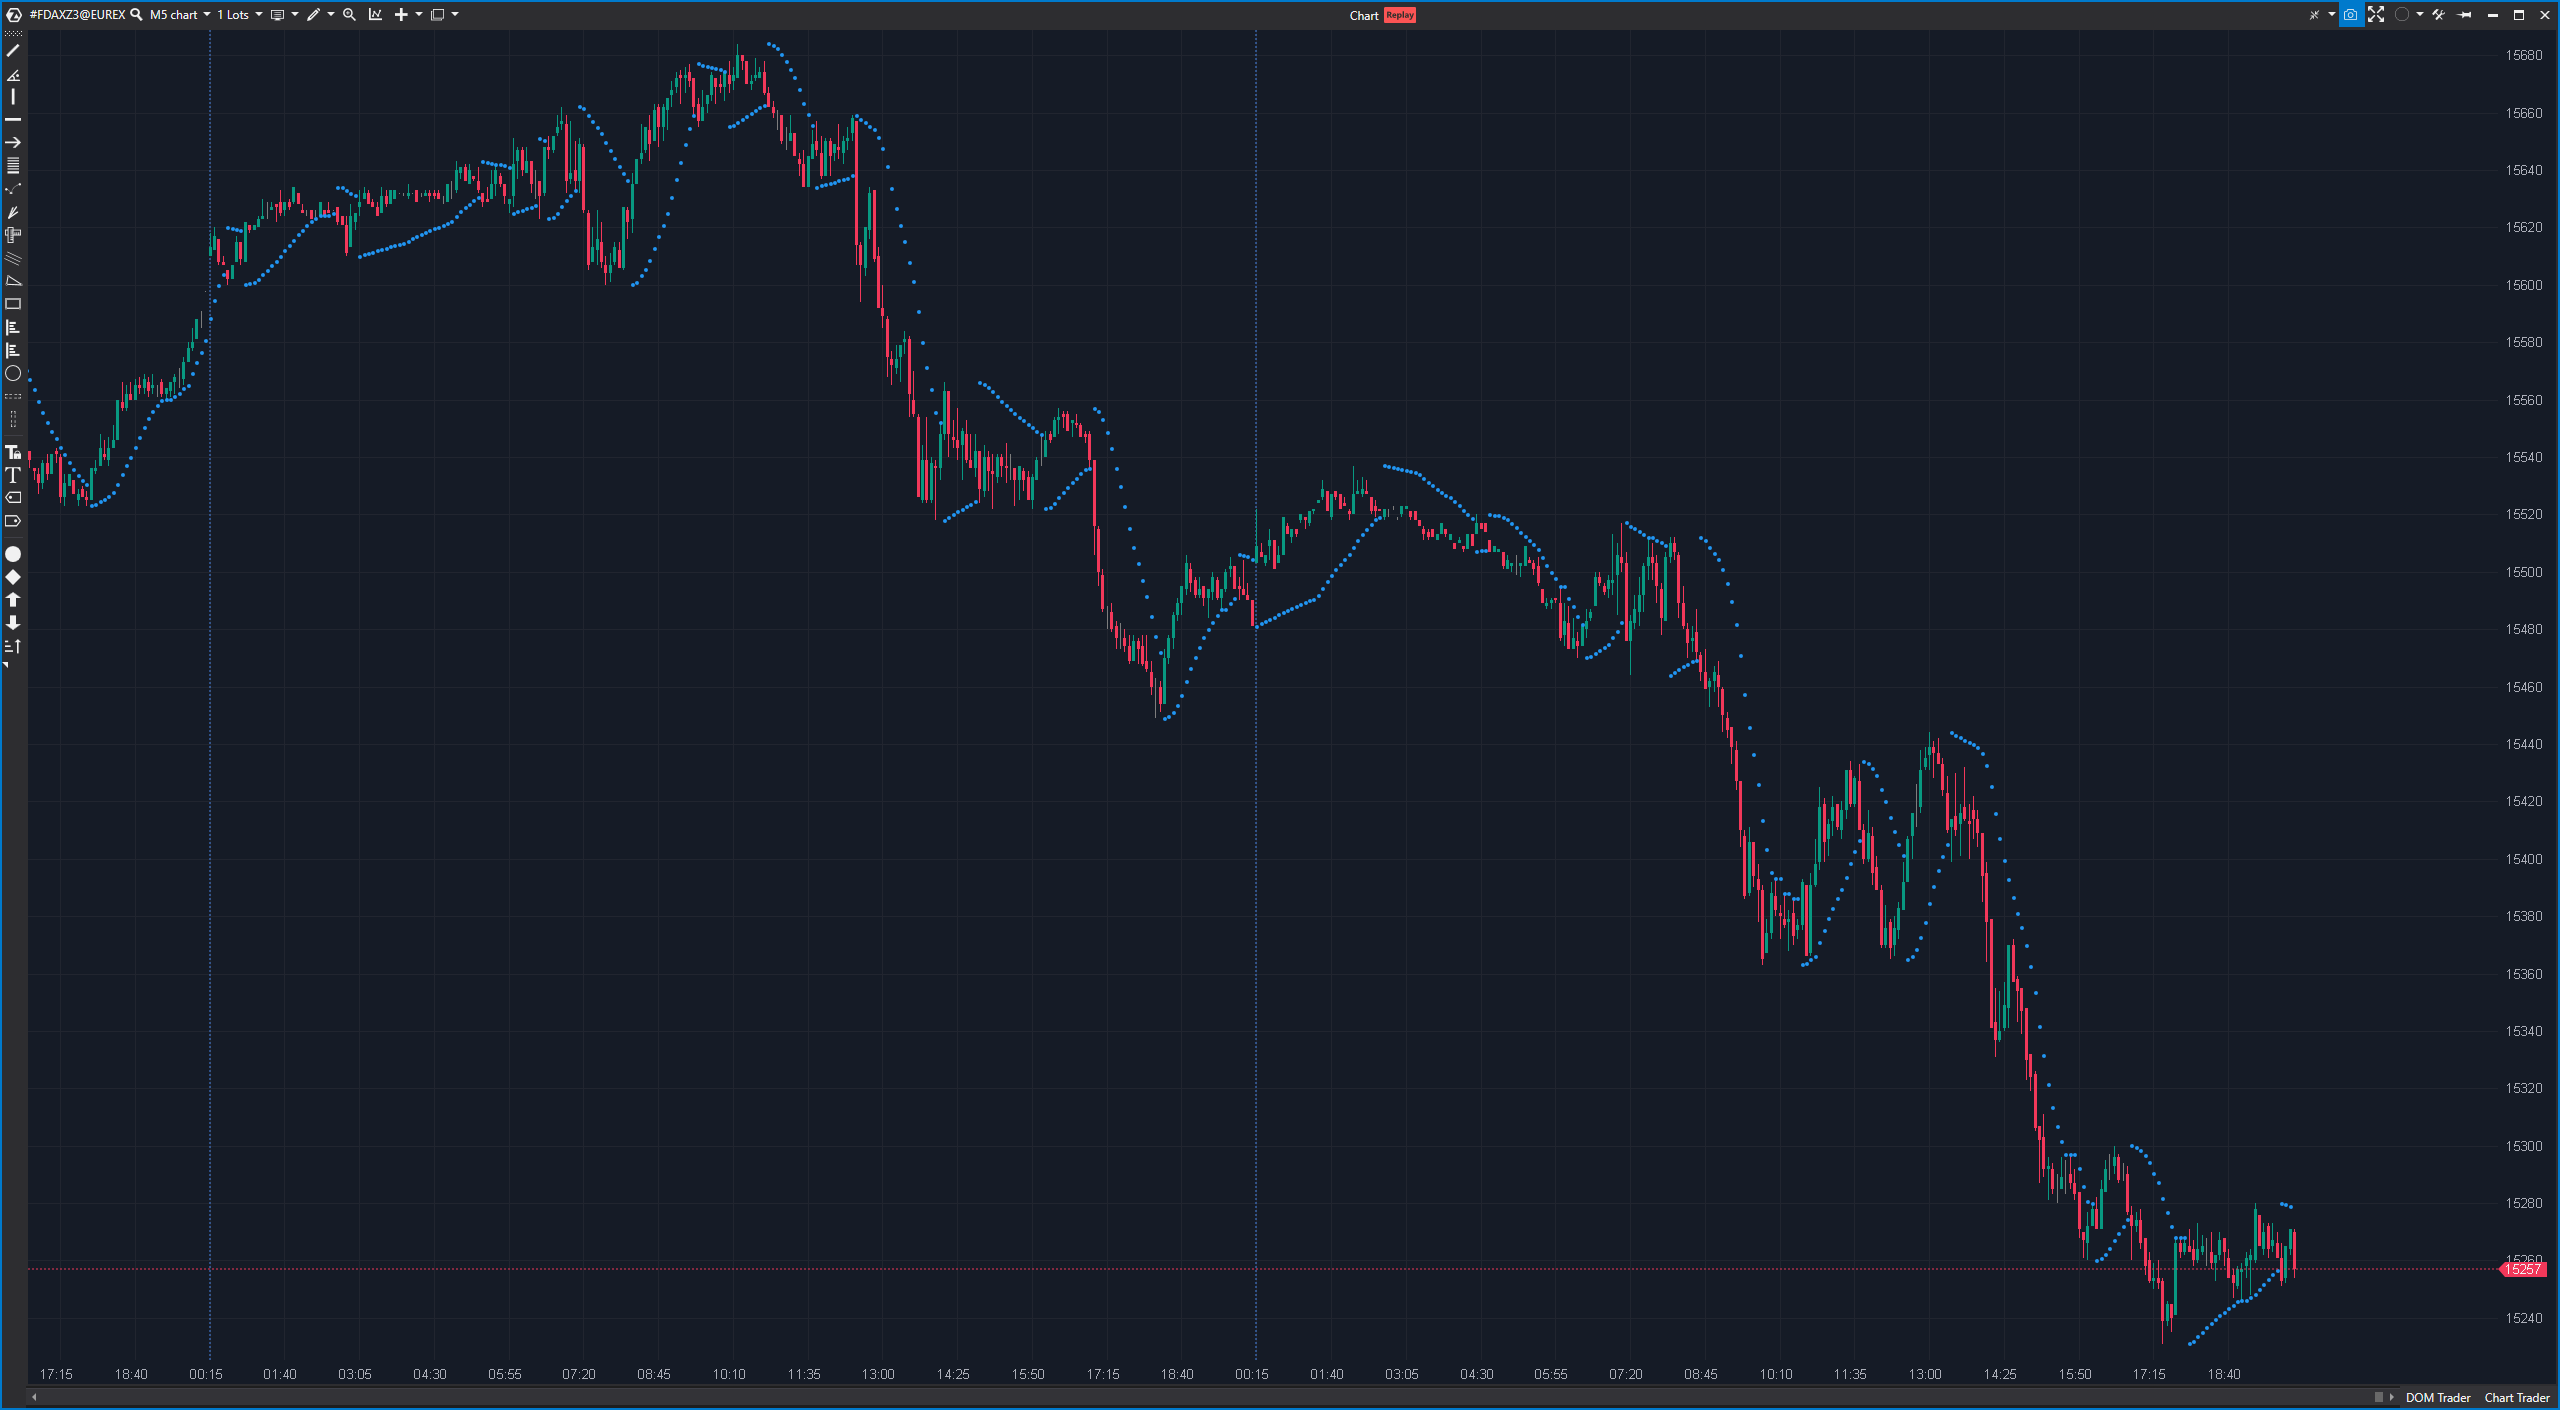
The Parabolic SAR shows points above or below the price bars that move over time. These points should help traders to recognize potential reversals or changes in direction of the trend.
How the Parabolic SAR works:
- If the Parabolic SAR point is below the price, this indicates a bullish trend.
- If the Parabolic SAR point is above the price, this indicates a bearish trend.
The Parabolic SAR points gradually move closer to the price when the trend is intact and can reverse and change direction when the trend weakens or reverses.
Advantages of the Parabolic SAR:
- Easy to use: The Parabolic SAR is easy to interpret as it provides clear signals for trend direction and potential reversals.
- Set stop-loss levels: The Parabolic SAR is often used to determine stop-loss levels. If the SAR point is below the price, it can be used as a stop-loss level for long positions, and if it is above the price, it can be used for short positions.
Disadvantages of the Parabolic SAR:
- False signals: The Parabolic SAR can show frequent changes in direction in volatile markets, which can lead to false signals.
- No trend strength: The Parabolic SAR does not provide any information on the strength of the trend. A point below or above the price only indicates the direction of the trend, not the intensity.
Practical application of the Parabolic SAR:
An example of the application of Parabolic SAR is the use of SAR points to set stop-loss levels and identify reversal points:
- If a Parabolic SAR point is above the price and moves downwards, this could indicate a potential trend reversal from bullish to bearish.
- If a Parabolic SAR point is below the price and moves upwards, this could indicate a potential trend reversal from bearish to bullish.
Traders can also monitor the distance between the SAR points and the price. If the SAR points are close to the price, this may indicate that the trend is weakening. A sudden change in SAR points can be interpreted as a reversal signal.
It is important to note that the Parabolic SAR is most effective when used in conjunction with other technical indicators and comprehensive market analysis. It should not be used alone for trading decisions. Risk management and an understanding of current market conditions are also crucial for success in trading.