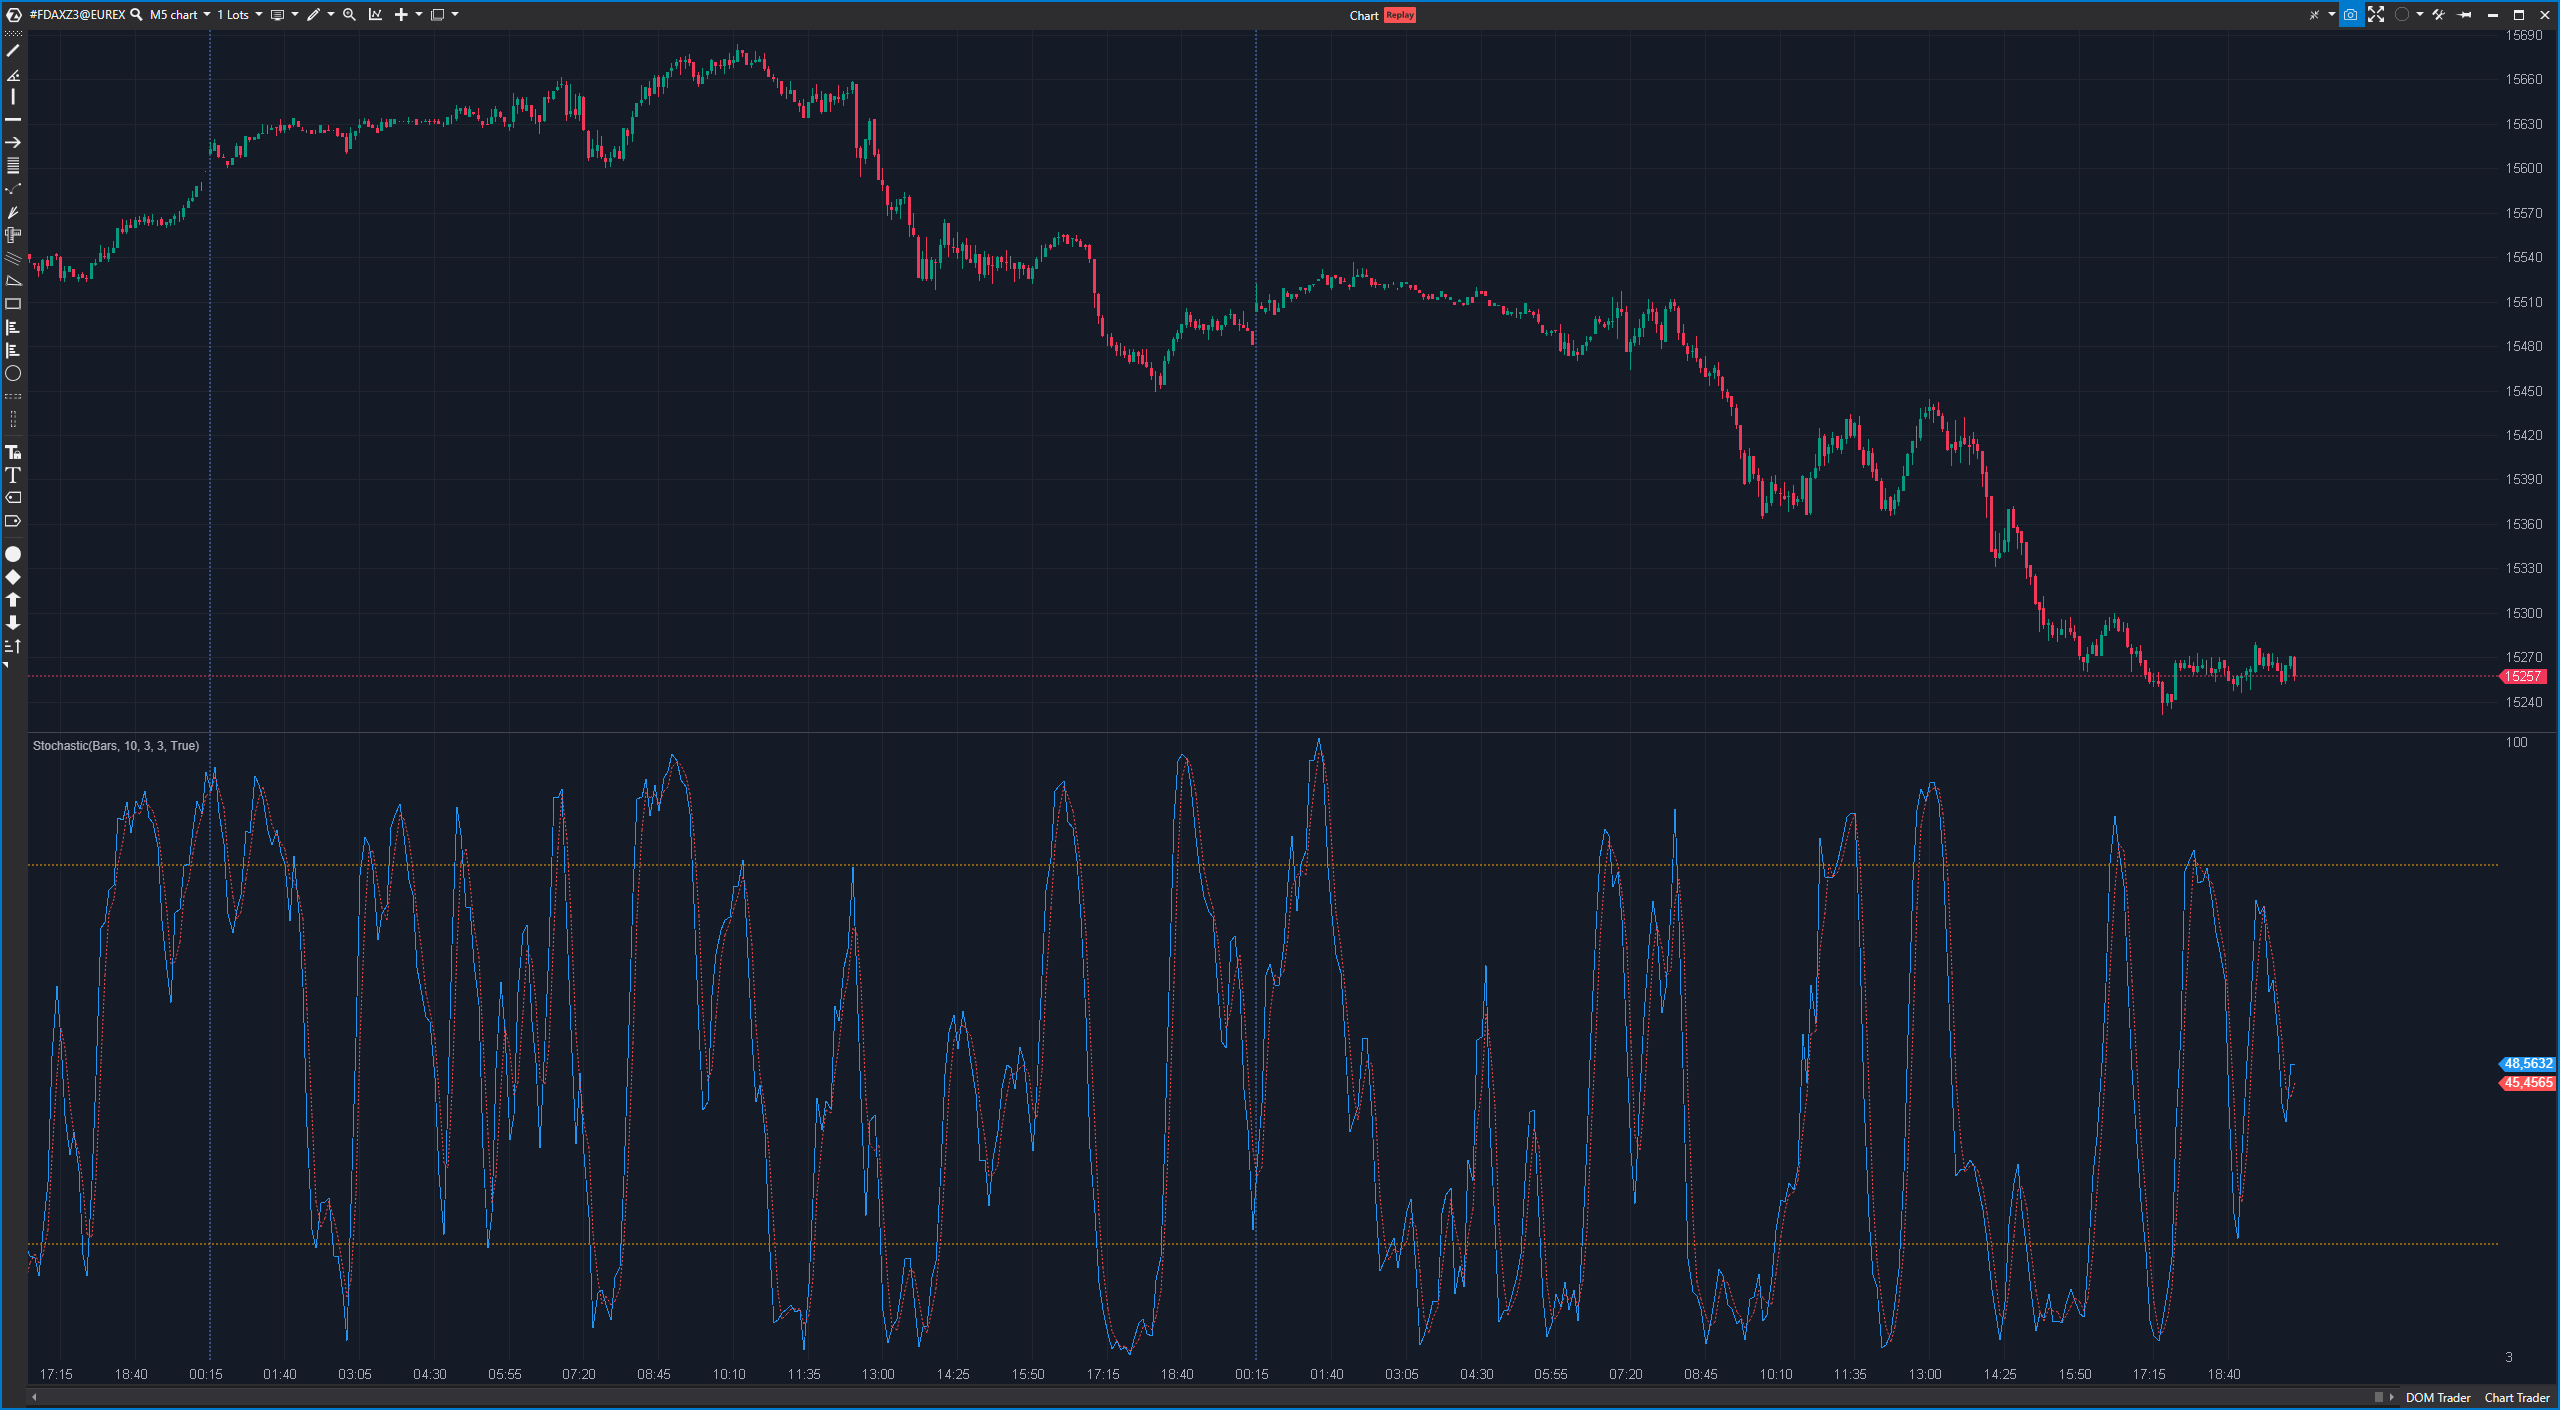
The Stochastic Oscillator is another popular technical indicator used to identify overbought and oversold conditions and predict potential trend reversals. The Stochastic Oscillator is an oscillating indicator that provides values between 0 and 100 and is normally displayed below the price chart on a chart. It is based on a comparison of the closing price of an asset with a price range over a certain period of time.
The Stochastic Oscillator is calculated in two main steps:
- Calculation of the %K line (fast line):
%K = ((Closing price – Lowest closing price in the period) / (Highest closing price in the period – Lowest closing price in the period)) * 100 - Calculation of the %D line (slow line):
%D = average of the last X values of the %K line (normally 3 or 5 periods)
Advantages of the Stochastic Oscillator:
- Overbought and oversold conditions: The Stochastic Oscillator helps identify overbought (typically above 80) and oversold (typically below 20) conditions, which can indicate potential trend reversals.
- Divergences: Similar to the RSI, divergences between the Stochastic Oscillator and price can indicate potential trend reversals.
- Simplicity: The Stochastic Oscillator is easy to calculate and display on charts.
Disadvantages of the Stochastic Oscillator:
- False signals: In strong trends, the Stochastic Oscillator can remain in overbought or oversold areas without a trend reversal being imminent. This can lead to false signals.
- Whipsaws: The Stochastic Oscillator can tend to generate rapid changes in direction, which is known as a “whipsaw”. This can lead to traders receiving frequent and inaccurate signals.
Practical application of the Stochastic Oscillator:
An example of the use of the Stochastic Oscillator is the identification of overbought and oversold conditions and the generation of buy and sell signals:
- Overbought conditions: When the Stochastic Oscillator rises above 80 and then falls back, this is often considered overbought and could indicate a possible trend reversal. This could be a sell signal.
- Oversold conditions: When the Stochastic Oscillator falls below 20 and then rises, this is often considered oversold and could indicate a possible trend reversal. This could be a buy signal.
Traders can also analyze the %K and %D lines of the Stochastic Oscillator and the relationship between them. A fast crossover signal (e.g. %K crosses %D from bottom to top) could be a buy signal, while a fast crossover signal from top to bottom could be a sell signal.
As with other technical indicators, it is important to use the Stochastic Oscillator in conjunction with other indicators and a comprehensive market analysis. It is also advisable to pay attention to risk management and use stop-loss orders to limit losses.