The SuperTrend indicator is a technical trend following indicator used in financial analysis and trading to identify trends in price charts and find potential entry and exit points in the market. This indicator is usually available on most trading platforms and is based on the volatility of the asset.
How the SuperTrend indicator works:
The SuperTrend indicator is based on two main components:
- Average True Range (ATR): The average true range is a measure of the average volatility of an asset over a given period.
- Factor (multiplier): The factor is a user setting that determines how strongly the SuperTrend indicator should react to price movements. A higher factor leads to a less sensitive line, while a lower factor leads to a more sensitive line.
The SuperTrend indicator is calculated in several steps:
- Step 1: Calculate the ATR over a specific period (e.g. 14 periods).
- Step 2: Multiply the ATR by the selected factor (e.g. 2).
- Step 3: Add the result from step 2 to the closing price line to obtain the upper SuperTrend line.
- Step 4: Subtract the result from step 2 from the closing price line to obtain the lower SuperTrend line.
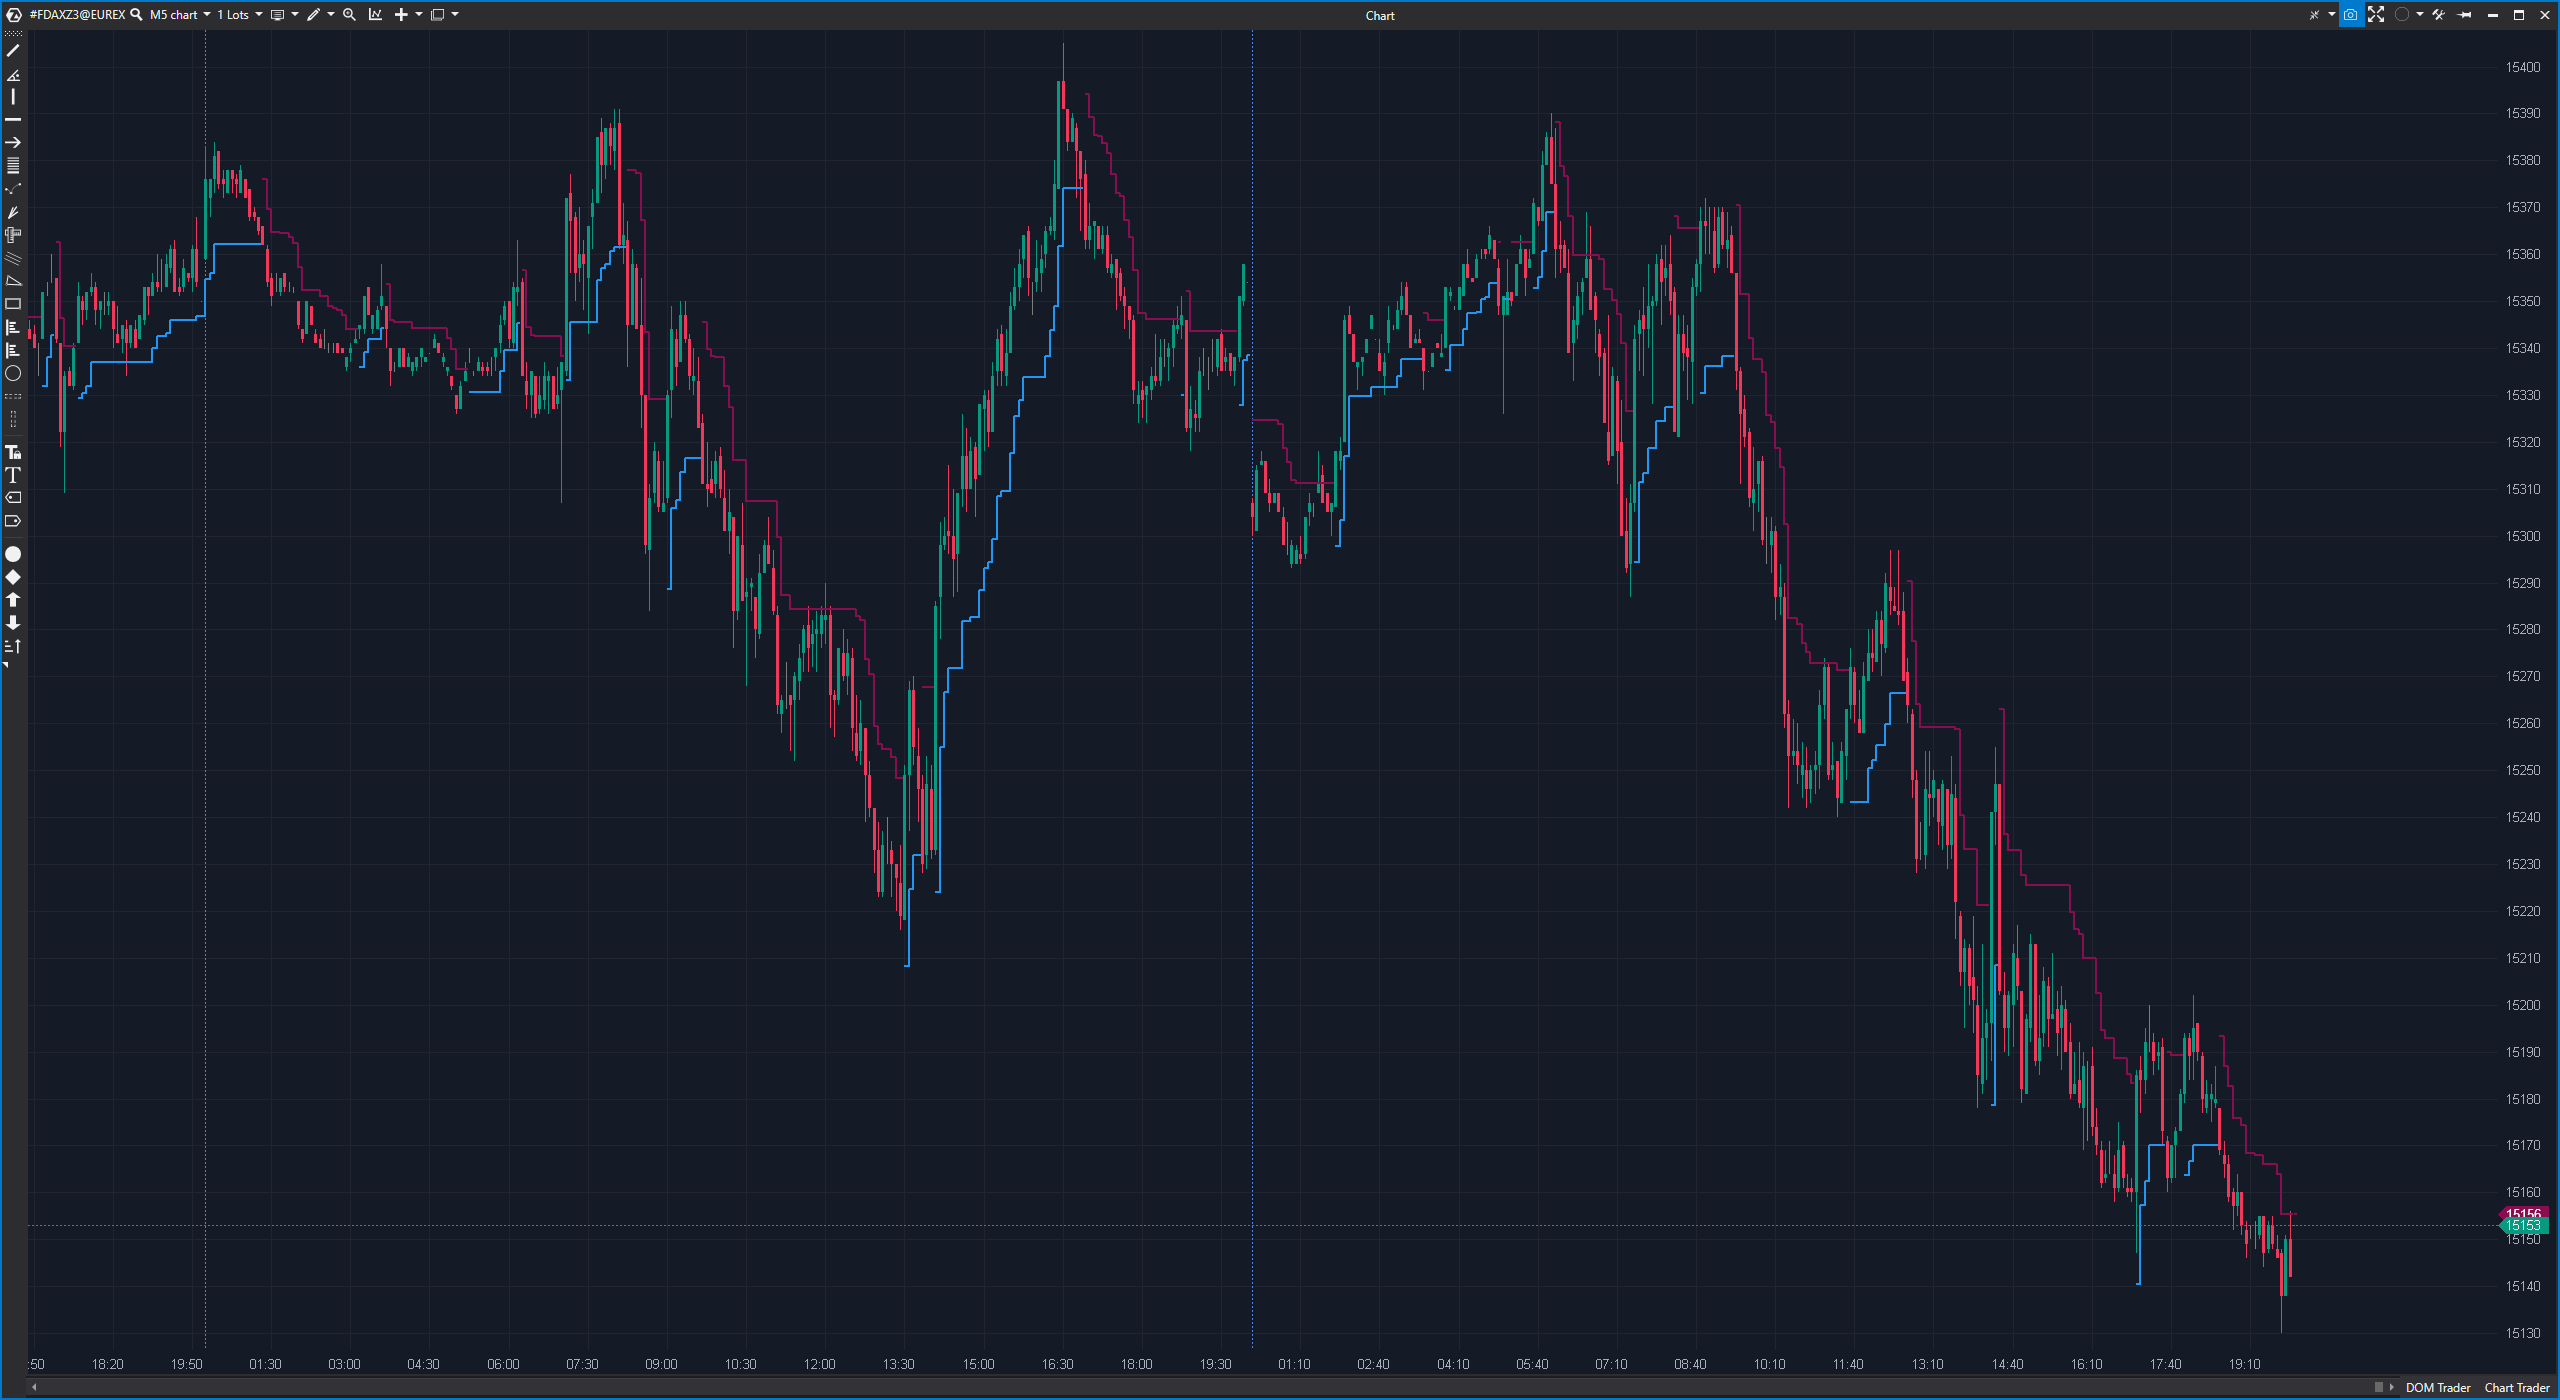
The upper and lower SuperTrend lines form bands around the price trend. If the price is above the upper line, this is considered a bullish signal, and if it is below the lower line, this is considered a bearish signal.
Advantages of the SuperTrend indicator:
- Trend confirmation: The SuperTrend indicator helps to identify and confirm trends, which is beneficial for trend-following strategies.
- Simple interpretation: The signals of the SuperTrend indicator are easy to interpret. A buy signal occurs when the price is above the upper line and a sell signal occurs when the price is below the lower line.
- Customizable settings: Traders can customize the factor to adjust the sensitivity of the indicator to their trading strategy and market conditions.
Disadvantages of the SuperTrend indicator:
- False signals: As with most technical indicators, false signals can also occur with the SuperTrend, especially if the market moves sideways or remains in a narrow range.
- Delay: The SuperTrend indicator is a backward-looking indicator as it is based on historical price data. This means that it does not always react quickly to changing market conditions.
Practical application of the SuperTrend indicator:
An example of the application of the SuperTrend indicator is the use of its signals to place trades:
- If the SuperTrend indicator shows a bullish signal (the price is above the upper line), a trader could enter a long position.
- If the SuperTrend indicator shows a bearish signal (the price is below the lower line), a trader could enter a short position.
Traders can also combine the SuperTrend indicator with other technical indicators or strategies to make informed trading decisions. It is important to note that the SuperTrend indicator should be used in conjunction with comprehensive market analysis and risk management principles to minimize losses and increase the likelihood of successful trades.