Stock market indicators can be divided into different categories depending on how they are used in financial analysis and what kind of information they provide. Here are some of the most common categories of stock market indicators:
- Trend following indicators: These indicators are used to identify and confirm trends in the market. Examples are the moving average, the Ichimoku Cloud indicator and the Parabolic SAR.
- Oscillators: Oscillators measure the overbought or oversold situation of an asset and can be used to identify potential reversal points. Examples are the Relative Strength Index (RSI), the Stochastic Oscillator and the Commodity Channel Index (CCI).
- Volume indicators: These indicators measure the trading volume of an asset and can provide information about the interest and activity of market participants. Examples are the On-Balance Volume (OBV) and the Money Flow Index (MFI).
- Volatility indicators: These indicators measure the volatility of an asset and can help in setting stop-loss levels and position sizing. One example is the Average True Range (ATR).
- Cyclical indicators: These indicators attempt to identify cyclical patterns in the markets and can be helpful in predicting trend reversals. Examples are the Elliott Wave Indicator and the Coppock Curve.
- Sentiment indicators: Sentiment indicators are based on market participant sentiment and can be used to determine whether the market is overbought or oversold. One example is the put/call ratio.
- Fundamental indicators: Fundamental indicators refer to economic or financial key figures and events that can influence the market. Examples are the price/earnings ratio (P/E ratio), the dividend yield and the unemployment rate.
- Composite indicators: Some indicators combine several of the above categories to enable more comprehensive trading decisions. Examples are the Moving Average Convergence Divergence (MACD) and the Relative Strength Index (RSI) Stochastic.
It is important to note that no single indicator alone is sufficient for trading decisions. Traders typically use a combination of indicators and also analyze other factors such as news, trends and fundamental data to make informed trading decisions. The choice of the right indicators depends on the individual trading strategy and the market conditions.
Alligator indicator
The Alligator indicator is a technical analysis indicator developed by Bill Williams. It is mainly…
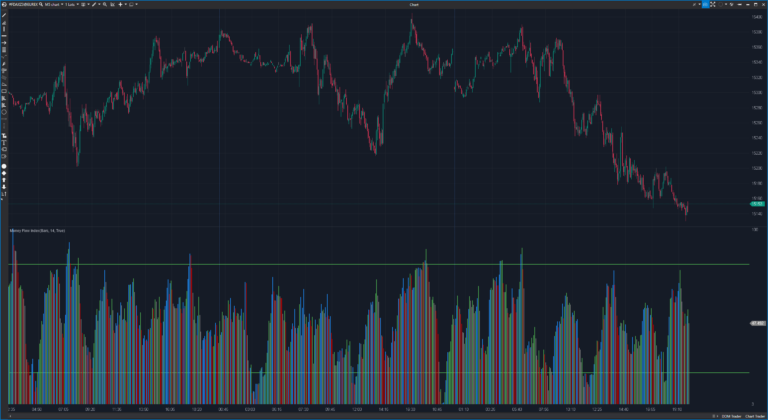
Money Flow Index
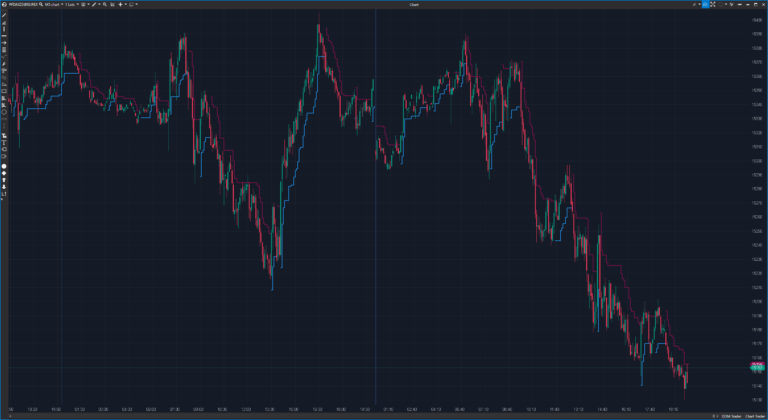
SuperTrend
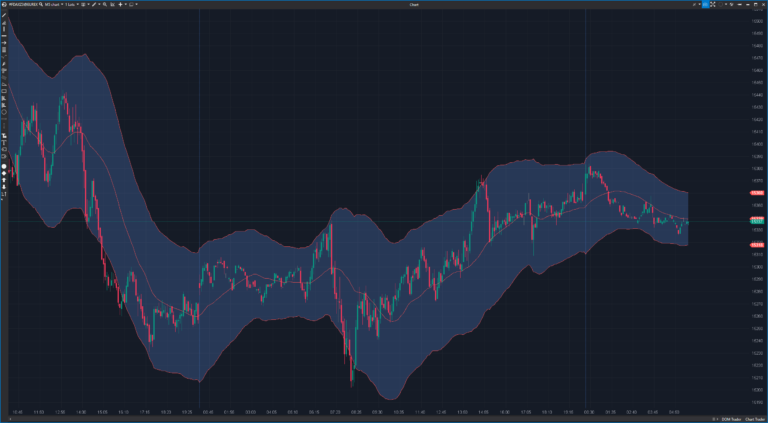
Keltner Canal
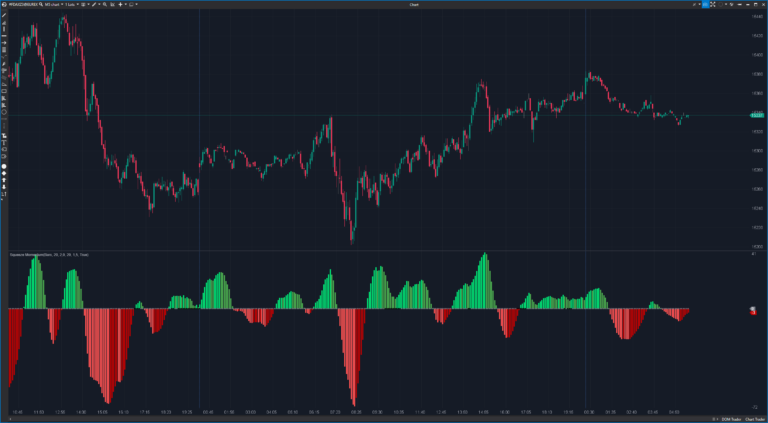
Super Squeeze
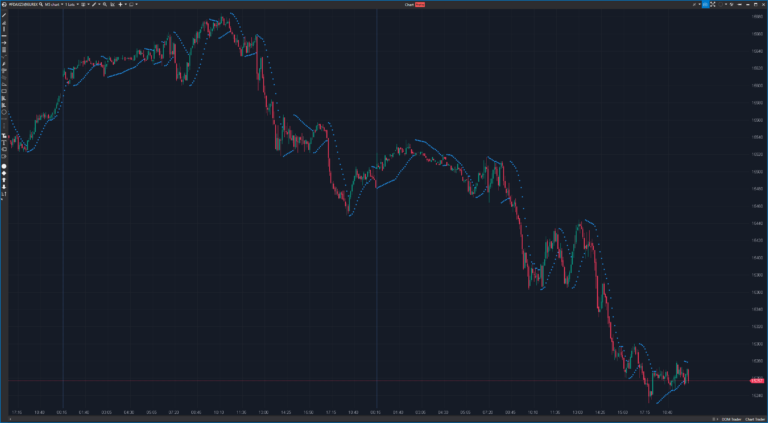
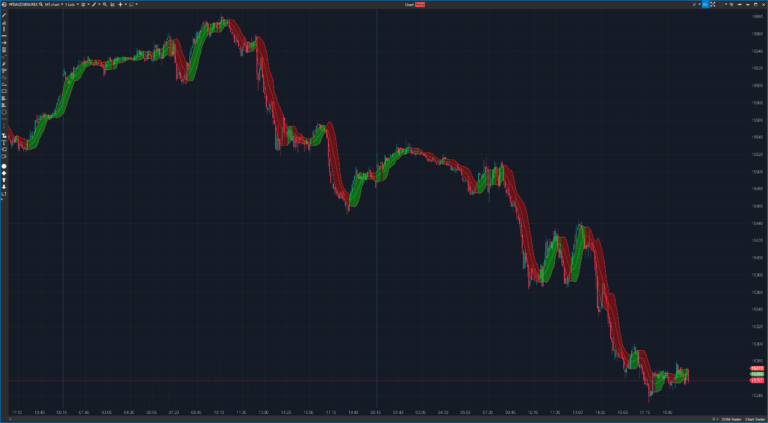
Parabolic SAR (Stop and Reverse)
The Parabolic SAR (Stop and Reverse) is a technical indicator developed by Welles Wilder and…
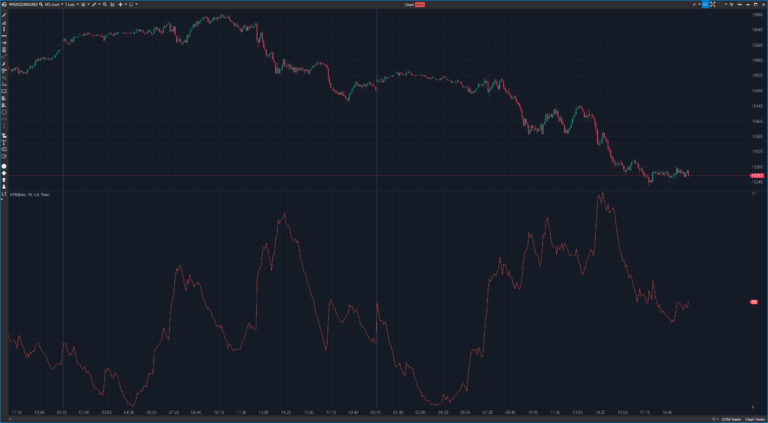
Average True Range (ATR)
The Average True Range (ATR) is a technical indicator used in financial analysis to measure…
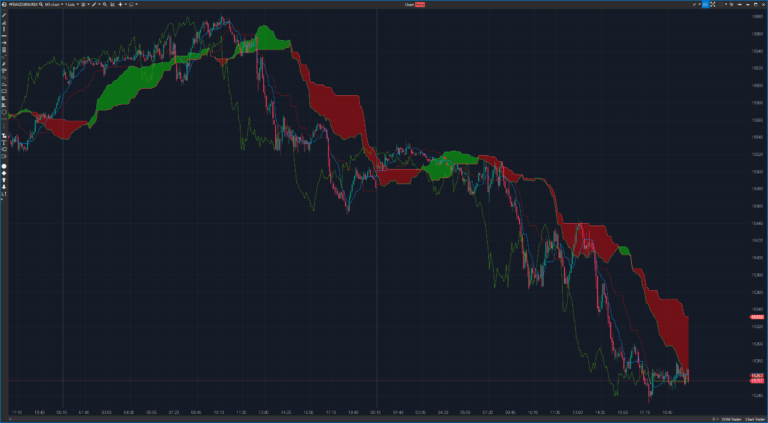
Ichimoku Kinko Hyo
The Ichimoku Cloud indicator, also known as Ichimoku Kinko Hyo, is a comprehensive technical indicator…
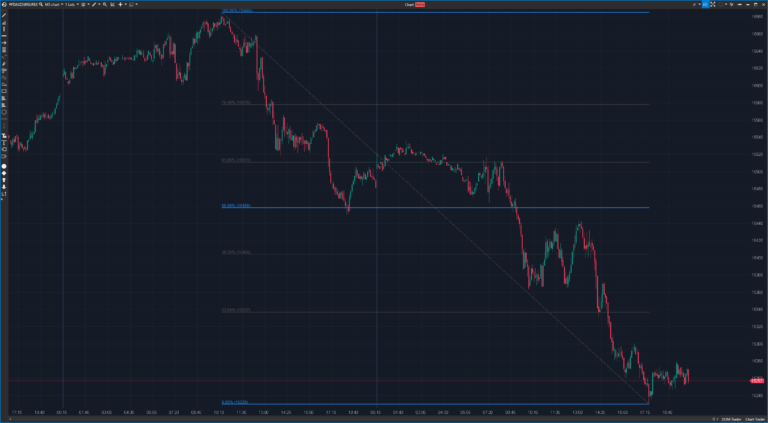
Fibonacci retracements
Fibonacci retracements are a technical indicator in financial analysis based on the mathematical concepts of…
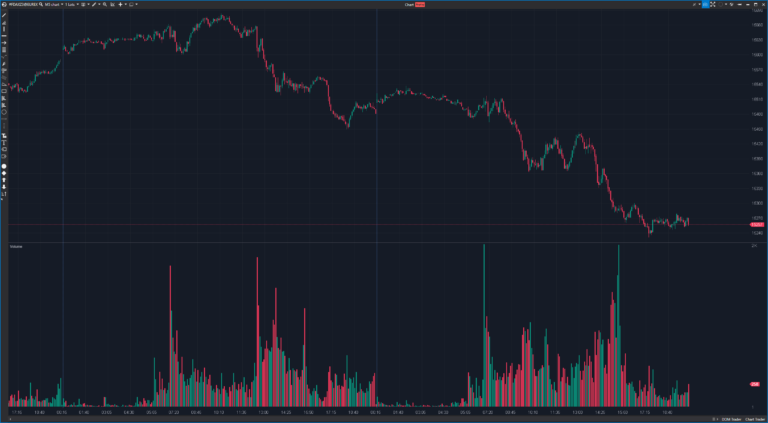
Trading volume (Volume)
Trading volume is an important technical indicator in financial analysis that measures the quantity of…
Bollinger Bands (Bollinger Bands)
The Bollinger Bands are a popular technical indicator used in financial analysis to measure the…
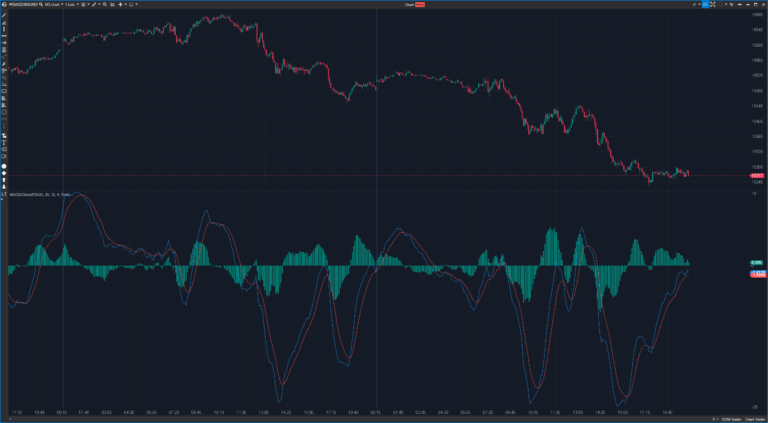
Moving Average Convergence Divergence (MACD)
The Moving Average Convergence Divergence (MACD) is a popular technical indicator used in the technical…
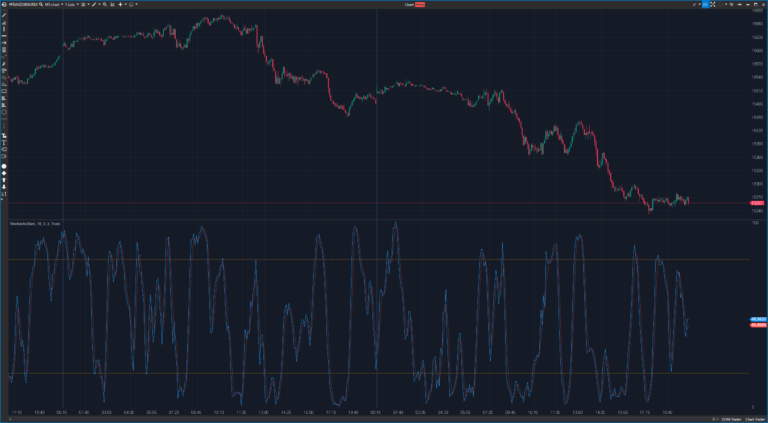
Stochastic Oscillator
The Stochastic Oscillator is another popular technical indicator used to identify overbought and oversold conditions…
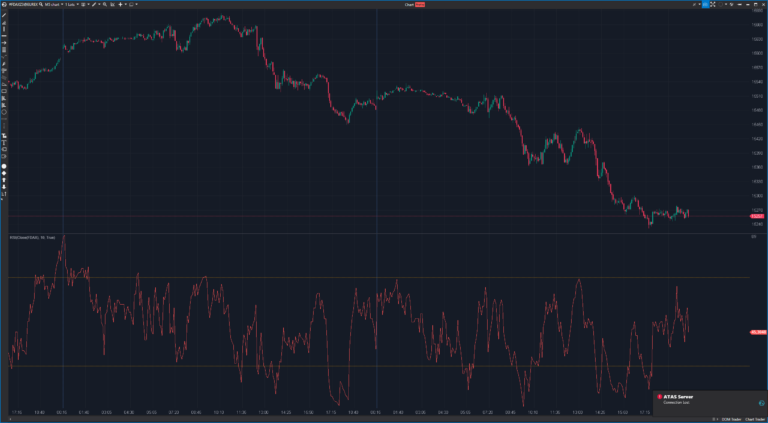
Relative Strength Index (RSI)
The Relative Strength Index (RSI) is a widely used technical indicator used in financial analysis…
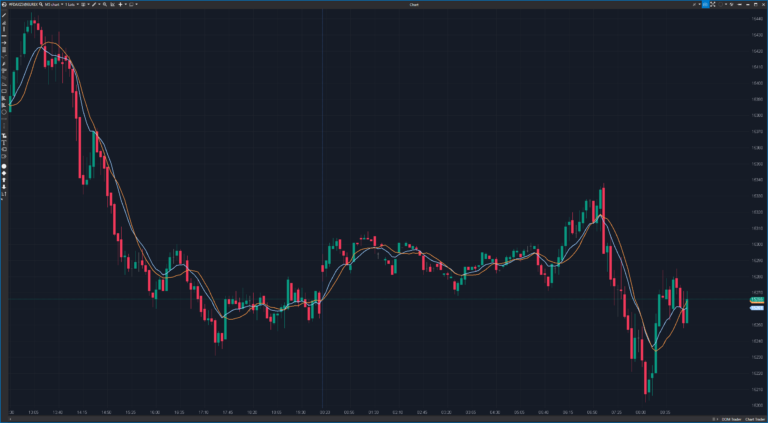
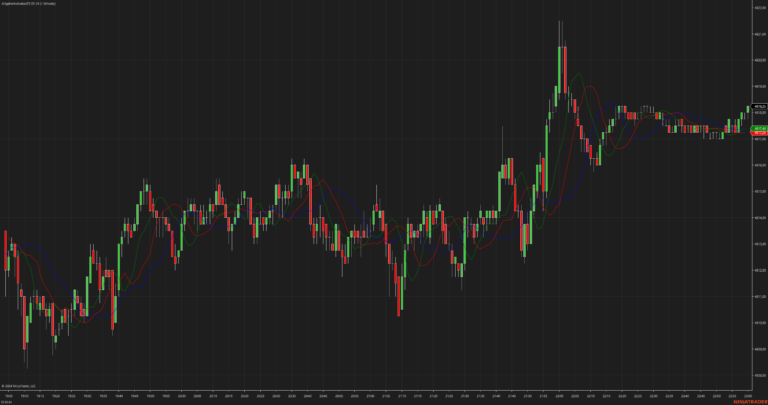
Moving Average (MA)
The moving average (MA) is a basic technical indicator that is widely used in financial…